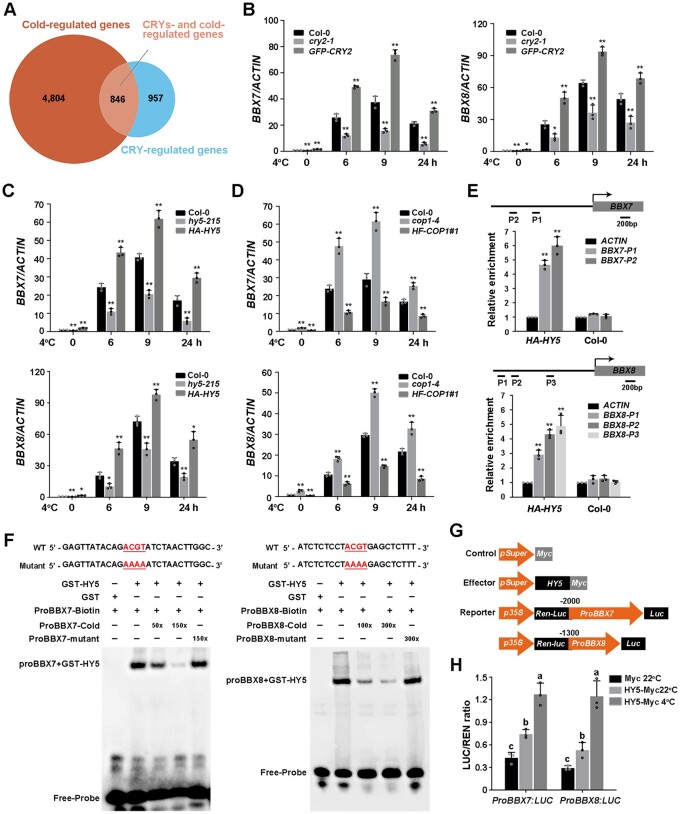
Figure 6.
Cold-induced expression of BBX7 and BBX8 is regulated by CRY2–COP1–HY5. A, Venn diagram indicating the number of CRY-regulated COR genes by comparing CRY-regulated genes (https://www.ncbi.nlm.nih.gov/bioproject/PRJNA318638; |log2| ≥ 1, adjusted P < 0.05) with COR genes (http://www.ncbi.nlm.nih.gov/sra/PRJNA732005; |log2| ≥ 1, adjusted P < 0.05) identified in previous studies. B–D, Relative expression levels of BBX7 and BBX8 under cold treatment in Col-0, cry2-1 and GFP-CRY2 (B), hy5-215 and HA-HY5 (C), and cop1-4 and HF-COP1#1 (D). Total RNA was extracted from 10-day-old LD-grown seedlings treated at 4°C for the indicated times. ACTIN2/8 was used as a normalization control. Expression in untreated Col-0 was set to 1.00. E, ChIP assays showing that HY5 binds to the BBX7 and BBX8 promoters in vivo. The 13-day-old HA-HY5 or WT (Col-0) seedlings grown under LD conditions were harvested for ChIP analysis using HA beads, and the amounts of the indicated DNA in the immune complex were analyzed by qRT-PCR. The ACTIN fragment was amplified as a control. Relative enrichment was calculated as Input% (indicated DNA)/Input% (control). F, EMSAs showing that HY5 binds to the promoters of BBX7 (P1) and BBX8 (P3) in vitro. Each biotin-labeled DNA fragment was incubated with recombinant GST-HY5 or GST proteins. Competition assays for labeled promoter sequences were performed by adding an excess of unlabeled wild-type or mutated probes. G, Schematic representation of the control, effector, and reporter constructs used in the dual-LUC assays. The LUC reporter constructs harboring BBX7 and BBX8 promoters were used as reporters. Effector constructs harboring the HY5 coding sequences were driven by the Super promoter. The Myc tag sequence driven by the Super promoter was used as a negative control. H, Transcriptional activation experiments show that HY5 activates the expression of BBX7 and BBX8 in vivo. Construct combinations were co-transfected in Arabidopsis protoplasts. Following incubation in the dark for 16 h, the protoplasts were treated in the light at 22°C (control) or 4°C for 1 h, and the samples were collected for dual-LUC analysis. LUC activity was normalized to Renilla (REN) LUC activity. In (B–E, and H), data are means of three independent experiments ± sd. In (B–D), asterisks indicate significant differences compared with Col-0 under the same treatment (*P < 0.05, **P < 0.01, Student’s t test). In (E), asterisks indicate significant differences compared with ACTIN fragment in HA-HY5 or WT (**P < 0.01, Student’s t test). In (H), different letters represent significant differences at P < 0.05 (one-way ANOVA and Tukey’s multiple comparison tests).

