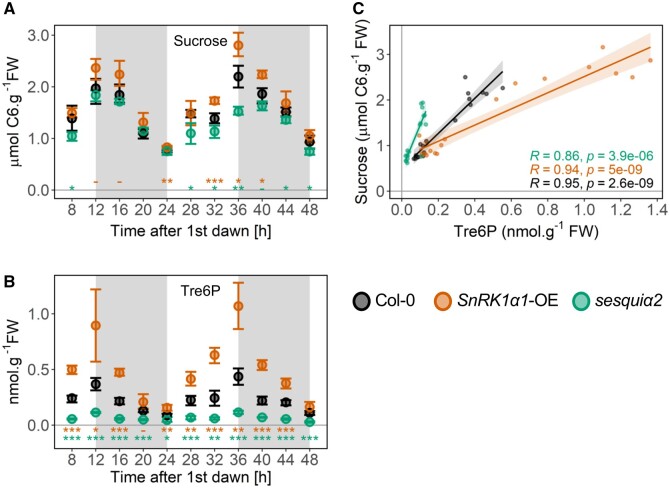
Figure 1.
Impact of SnRK1 on sucrose and Tre6P accumulation and their relationship. Sucrose (A) and Tre6P (B) levels were quantified from 20-d-old Col-0, SnRK1α1-OE, and sesquiα2 plants grown under a 12:12 photoperiod and harvested every 4 h. The night period is marked in grey. Graphs show the average of four to five biological replicates (each composed of a pool of four to five randomly sampled whole rosettes) at each time point, with error bars representing the 95% confidence interval. Asterisks denote statistically significant differences tested at each ZT for both genotypes separately (one-way ANOVA with Tukey’s post hoc test of honestly significant differences, HSD). -P < 0.1 cases in which the Tukey’s HSD test resulted in non-significant differences; *P < 0.05; **P < 0.01; ***P < 0.001. C, Impact of SnRK1 on the Tre6P-sucrose relationship. The Tre6P content of samples at ED (12 h and 36 h after first dawn) and EN (24 h and 48 h after first dawn) was plotted against the corresponding values of sucrose. R, Pearson correlation coefficient. Sucrose levels correspond to hexose equivalents.

