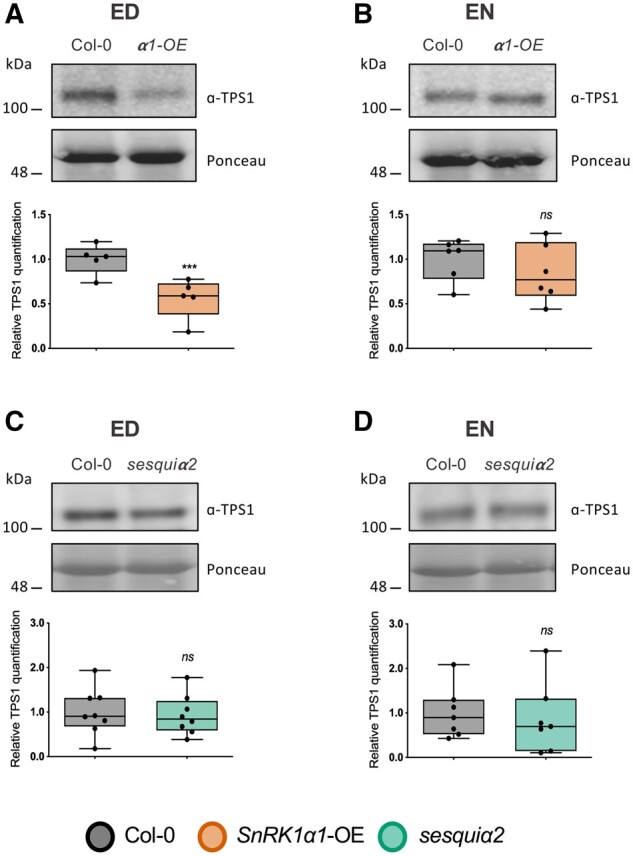
Figure 2.

Impact of SnRK1 on TPS1 protein accumulation. Levels of TPS1 protein were quantified by immunoblot analyses in Col-0 control plants and SnRK1α1-OE (A, B) and sesquiα2 (C, D) mutants at ED (A, C) and EN (B, D). Upper parts, representative immunoblots for the TPS1 protein. Lower parts, boxplots representing a minimum of four biological replicates (each consisting of a pool of three randomly harvested rosettes). Lower and upper box boundaries represent the first and third quantiles, respectively, horizontal lines mark the median and whiskers mark the highest and lowest values. Dots represent individual datapoints. P-values denote statistically significant differences between SnRK1 mutants and Col-0 at the indicated times of the day (paired t test); NS, nonsignificant; ***P < 0.001.
