Figure 5.
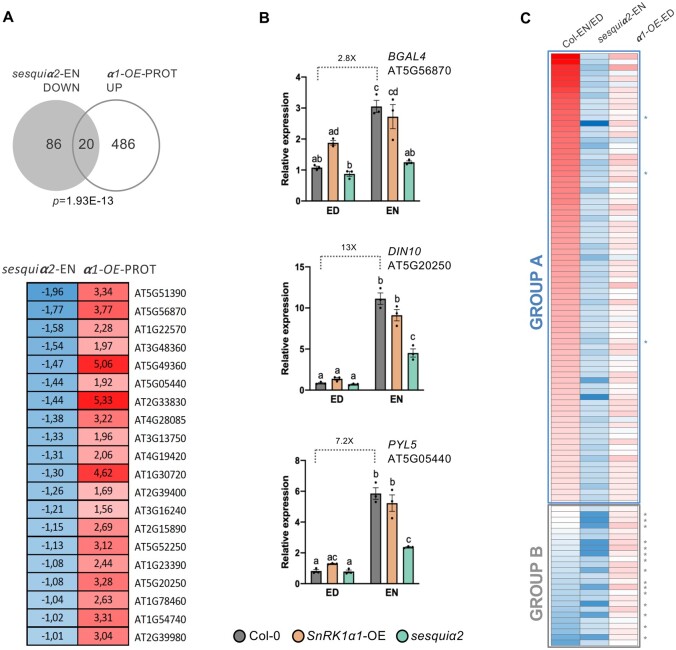
Basal expression of SnRK1-regulated genes at the ED and EN periods. A, Upper panel, overlap of genes downregulated in the sesquiα2 mutant at EN (“sesquiα2-EN DOWN”) and those induced by transient SnRK1α1 overexpression in protoplasts (“α1-OE-PROT UP”; Baena-González et al., 2007). P-value denotes statistical significance (hypergeometric test). Lower panel, expression values (log2FC) of the overlapping genes in each of the indicated datasets. Red indicates upregulation and blue, downregulation. B, RT-qPCR analyses of genes (BGAL4, DIN10, and PYL5) from the overlapping set in (A) in rosettes of the indicated genotypes at ED and EN. Graphs correspond to the average of three independent experiments (error bars, sem (Standard Error of the Mean)). Letters indicate significantly different groups assessed using the ANOVA and Tukey’s HSD post test. C, Genes downregulated in the sesquiα2 mutant at EN (“sesquiα2-EN DOWN”) are mildly upregulated in SnRK1α1-OE at ED. In Col-0, many of these genes are upregulated at EN versus ED (Group A, blue rectangle; asterisks correspond to BGAL4, DIN10, and PYL5). A smaller group of genes show either unchanged or lower expression in Col-0 at EN versus ED (Group B, gray rectangle). Asterisks correspond to the following genes, retrieved as DEGs in sesquiα2 at ED (see Supplemental Table S3b): IMA1/IRP1, IMA2/IRP2, IMA3, IMA4, IMA6, IRP3, IRP4, IRP6, PAP14/ORG1, BHLH38/ORG2, BHLH39/ORG3, BHLH100, BHLH101, FRO3, AT1G12030.

