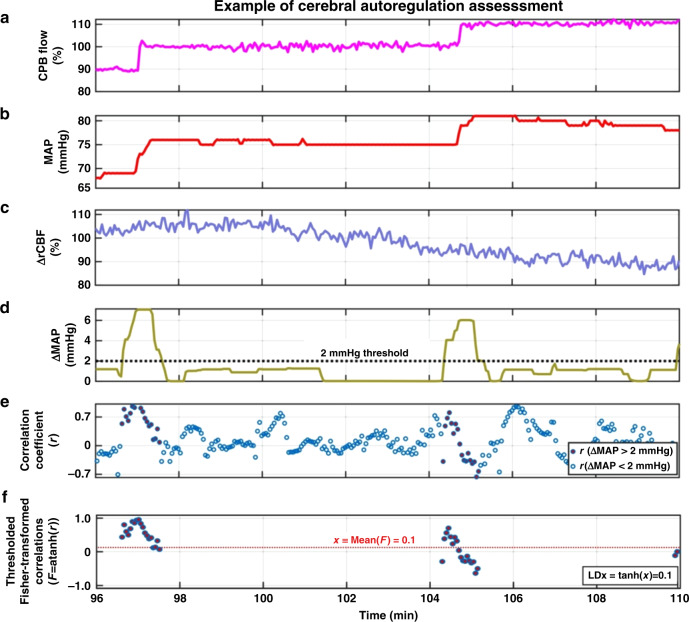
Fig. 2. Case demonstration of how cerebral autoregulation was assessed in one piglet.
The assessment used temporal measurements of MAP (b) and rCBF (c) during modulation of CPB flow (a). A 45-s moving window with maximal overlap was used to sample the data. For each window, the absolute change (maximum-minimum) in MAP (ΔMAP, d), and the Pearson correlation between MAP and rCBF (r, e) were calculated. The set of correlation coefficients for which ΔMAP exceeded 2 mmHg were then Fisher-transformed, and the hyperbolic tangent of their average returned a single LDx value for the assessment (f). In this piglet, rCBF was overall uncorrelated with MAP, resulting in an LDx of 0.1.

