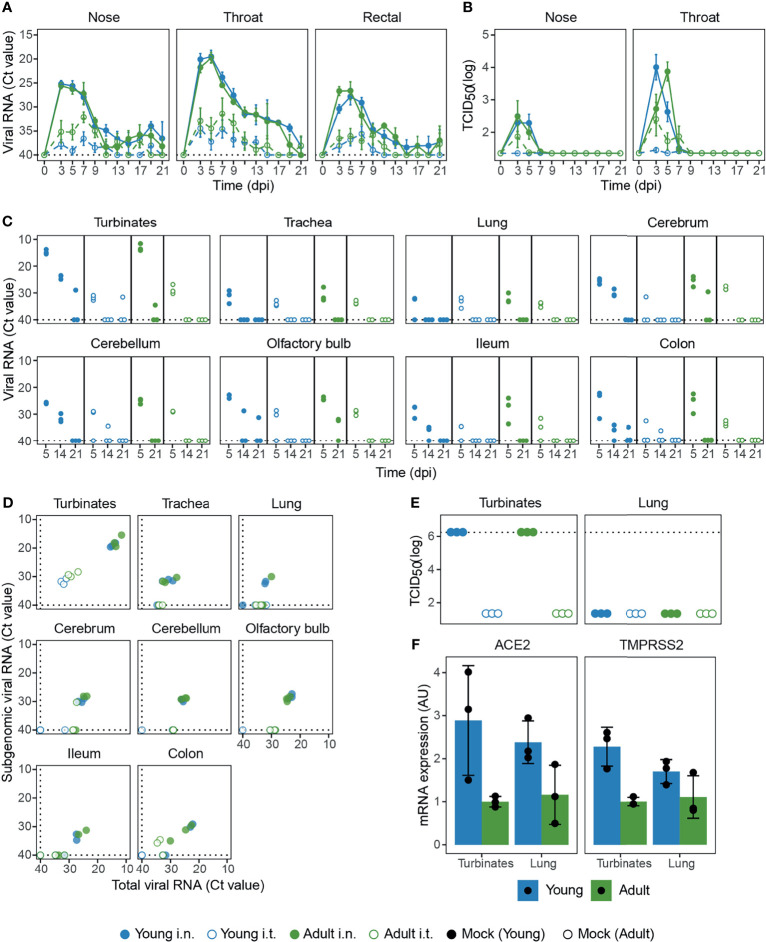
Figure 2.
Viral load in swabs and tissues of SARS-CoV-2 infected ferrets. (A, B) Viral load measured by RT-qPCR (A) and TCID50-assay (B) in swabs collected from SARS-CoV-2 infected ferrets on various days post infection (dpi). (C) Viral RNA in tissues at 5, 14 and 21 dpi measured by RT-qPCR. (D) Total viral RNA on 5 dpi as depicted in (C) plotted against subgenomic viral RNA. (E) Infectious virus detected by TCID50-assay in nasal turbinates and lung 5 dpi. (F) Expression of SARS-CoV-2 receptor ACE2 and TMPRSS2 protease in nasal turbinate and lung tissue of placebo animals, plotted as arbitrary units (AU). In panels (A, C, D) RT-qPCR negative specimens were set to a Ct-value of 40 for visualization purposes, which is depicted by dotted lines. In panel (E), dotted lines depict the highest dilution tested. For (A, B) n = 3-9. For (C, F) with exception of ‘Adult i.t.’ on 14 dpi (n = 2), all groups are n = 3.

