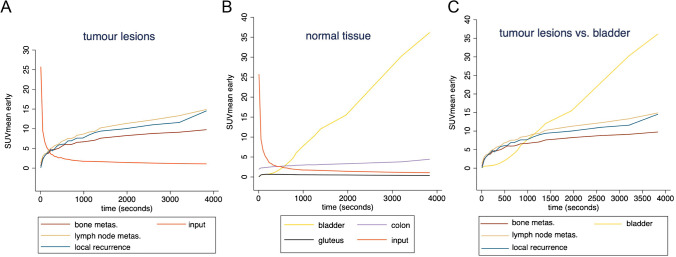
Fig. 5.
Mean time-activity curves of tumour lesions (left diagram A) and normal tissue (middle diagram B) vs. input (red curve). TAC of tumour lesions vs. bladder activity (gold curve) is shown in the right diagram (C). Tumour lesions showed the steepest incline within the first few minutes, before flattening out to different degrees while maintaining a continuous raising uptake. Normal tissue showed a low and plateau-like uptake, except for the bladder which began accumulating slowly after 7 to 8 min p.i. and showed the steepest incline of all lesions 15 min p.i

