Fig. 6.
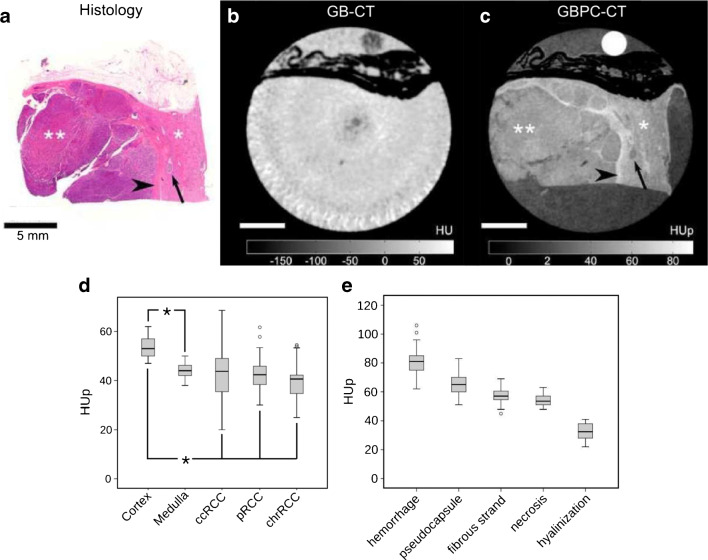
A papillary renal cell carcinoma (RCC) sample imaged with a GBPC-CT setup is shown by way of example. The corresponding histological slice (a) is presented next to the tomographic slice of the attenuation contrast (b) and phase contrast (c) signal. A clear discrimination between healthy (*) and tumorous (**) renal cortex is visualized in the phase contrast signal, which is not the case for the attenuation signal. The arrowhead points to a pseudo-capsule around the tumor which was also not revealed in the attenuation signal. In subfigure (d), the HUp values of different RCC types (ccRCC: clear cell, pRCC: papillary, chrRCC chromophobe RCC) as well as cortex and medulla are shown. Subfigure (e) depicts quantitatively different RCC features. Figure adapted from Braunagel et al. [63]. This figure is licensed under the Creative Commons Attribution (CC BY)

