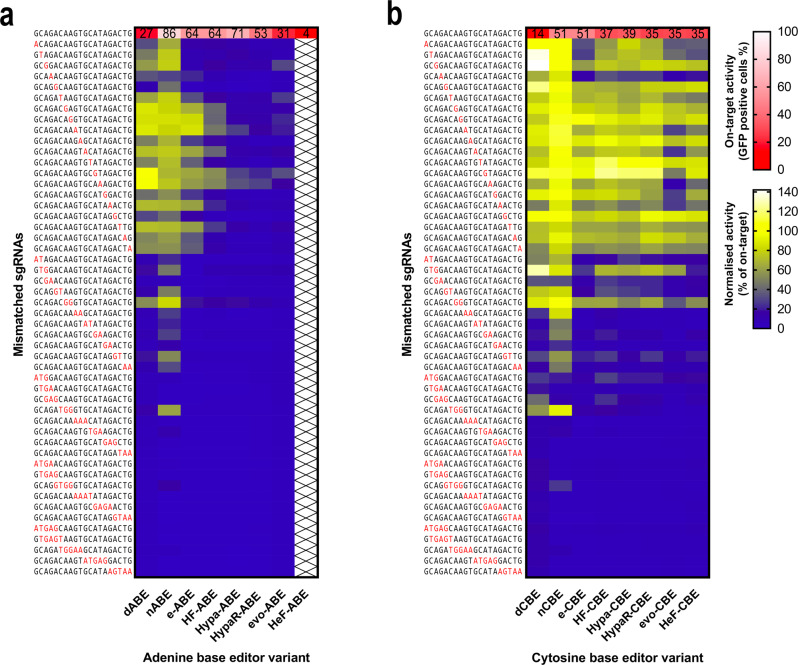
Fig. 6. Off-target activities of various ABE and CBE variants with 50 mismatched sgRNAs.
Mismatch tolerance of ABE (a) and CBE (b) and their increased fidelity variants were compared utilising the same matching sgRNA (target 1 in Fig. 5) and 50 sgRNAs mismatching in one, two, three, four or five positions as indicated as red letters. Blue and yellow heatmaps show the mean normalised activity (off-target/on-target) derived from three parallel transfections. White and red heatmaps show the on-target activity (mean rates of GFP positive cells) derived from three parallel transfections. For source data see the Source Data file.

