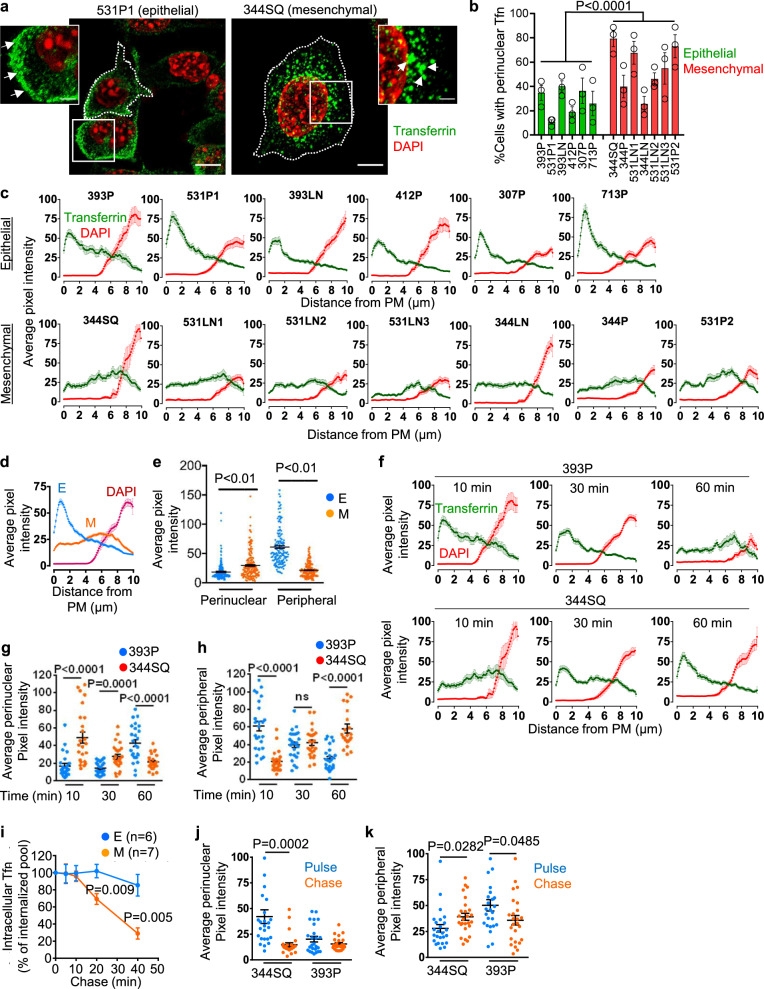
Fig. 2. Distinct transferrin (Tfn) trafficking patterns in epithelial and mesenchymal lung adenocarcinoma (LUAD) cells.
a, b Confocal micrographs taken 10 min after initiating endocytosis of Alexa 568-labeled Tfn. Insets illustrate peripheral and perinuclear Tfn in 531P1 cells and 344SQ cells, respectively. Scale bars: 10 µm, 3 µm (inset). Cells are outlined (dotted lines) (a). Each cell line is scored based on the percentage of total cells that have perinuclear Tfn. n = 3 independent experiments, 100 cells scored per experiment (b). c Alexa 568-labeled Tfn and DAPI signal intensities (y-axis) plotted on lines drawn from the plasma membrane (PM) inwards (x-axis) in cells fixed 10 min after initiating endocytosis. Results are averages of 3 linescans per cell, 19 cells per cell line. d Tfn and DAPI signals from (c) were expressed as mean values for epithelial (“E”) and mesenchymal (“M”) LUAD cell lines. e Tfn signal intensities in perinuclear and peripheral compartments of each cell (dot). Values represent the maximal signal intensities in each cell (n = 152 epithelial cells and 177 mesenchymal cells from 3 independent experiments). f Alexa 568-labeled Tfn and DAPI signal intensities determined as described in (c) 10, 30, and 60 min after initiating endocytosis. g, h Maximum signal intensities in peripheral (g) and perinuclear (h) compartments of each cell (dot). n = 25 cells from 3 independent experiments. i In-cell ELISA of intracellular Tfn levels. Results normalized based on total protein content. n = 6 (epithelial), or 7 (mesenchymal) cell lines. j, k Tfn staining intensities in perinuclear (j) and peripheral (k) compartments of each cell (dot). Cells were pulsed for 10 min with Alexa 568-labeled Tfn and chased for 10 min with unlabeled Tfn. Signal intensities after pulse alone (blue) or pulse/chase (red) were determined. n = 25 cells from 3 independent experiments. Data are presented as mean values ± SEM; P values, two-tailed Student’s t test.

