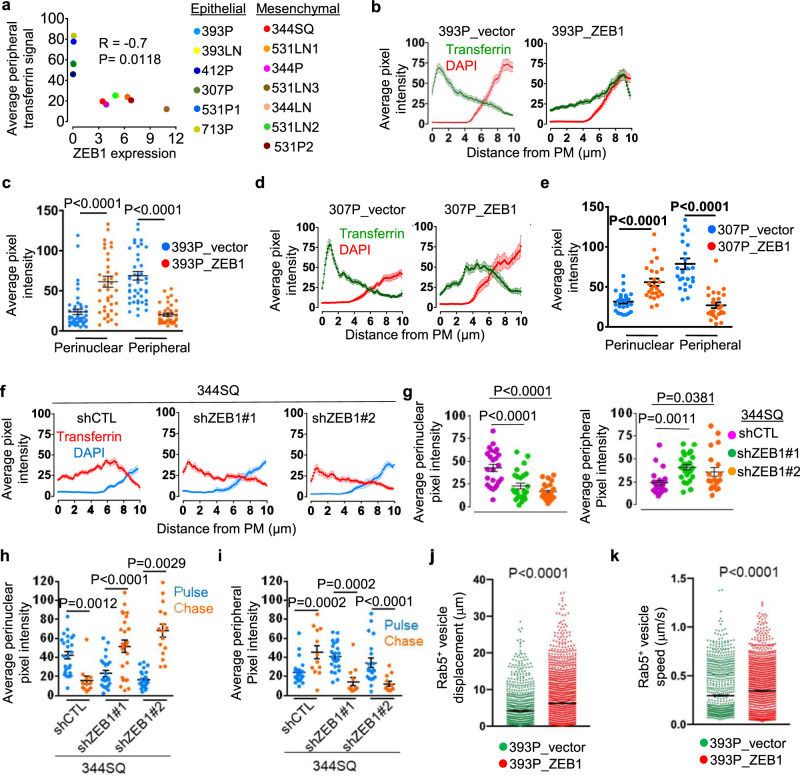
Fig. 3. ZEB1 accelerates vesicular trafficking through the endocytic recycling pathway.
a Correlation of endogenous ZEB1 expression levels with Alexa 568-labeled Tfn signal intensities in peripheral compartments of murine LUAD cell lines fixed 10 min after initiating endocytosis. b Alexa 568-labeled Tfn and DAPI signal intensities (y-axis) on straight lines drawn from the PM inwards (x-axis) in 393P cells that have an ectopic expression of ZEB1 or empty vector. Cells fixed 10 min after initiating endocytosis. Results represent averages of 3 linescans per cell, ≥40 cells per cell line. c Tfn signal intensities in perinuclear and peripheral compartments of each cell (dot). Values represent the maximal signal intensities in each cell. n = 47 cells (393P_vector) or 40 cells (393P_ZEB1) cells from 3 independent experiments. d, e Alexa 568-labeled Tfn linescan plots (d) and perinuclear and peripheral signal intensities (e) in 307P cells that have an ectopic expression of ZEB1 or empty vector and were fixed 10 min after initiating endocytosis. n = 25 cells from 3 independent experiments. f, g Alexa 568-labeled Tfn linescan plots (f) and perinuclear and peripheral signal intensities (g) in ZEB1 (shZEB1 #1 or #2)- or control (shCTL) shRNA-transfected 344SQ cells fixed 10 min after initiating endocytosis. n = 25 cells (shZEB1 #1) or 20 cells (shZEB1 #2) from 3 independent experiments. h, i Tfn signal intensity in shZEB1- and shCTL-transfected 344SQ cells pulsed for 10 min with Alexa 568-labeled Tfn and chased for 10 min with unlabeled Tfn. Signal intensities in perinuclear (h) and peripheral (i) compartments after pulse alone (blue) or pulse/chase (red) were determined. Values represent the maximal signal intensities in each cell. For pulse/chase (h), n = 12 cells (shCTL), 25 cells (shZEB1 #1), or 16 cells (shZEB1 #2) from 2 independent experiments. For pulse/chase (i), n = 12 cells from 2 independent experiments. j, k Displacement (j) and speed (k) of each Rab5+ vesicle (dot) in 39P_vector cells and 393P_ZEB1 cells that express mCherry-tagged Rab5, an early endosomal marker. Data represent mean ± S.E.M (n = 3 movies, 2 cells per movie, 600 frames per cell). Data are presented as mean values ± SEM; R value, Spearman; P values, two-tailed Student’s t test; or ANOVA (g).

