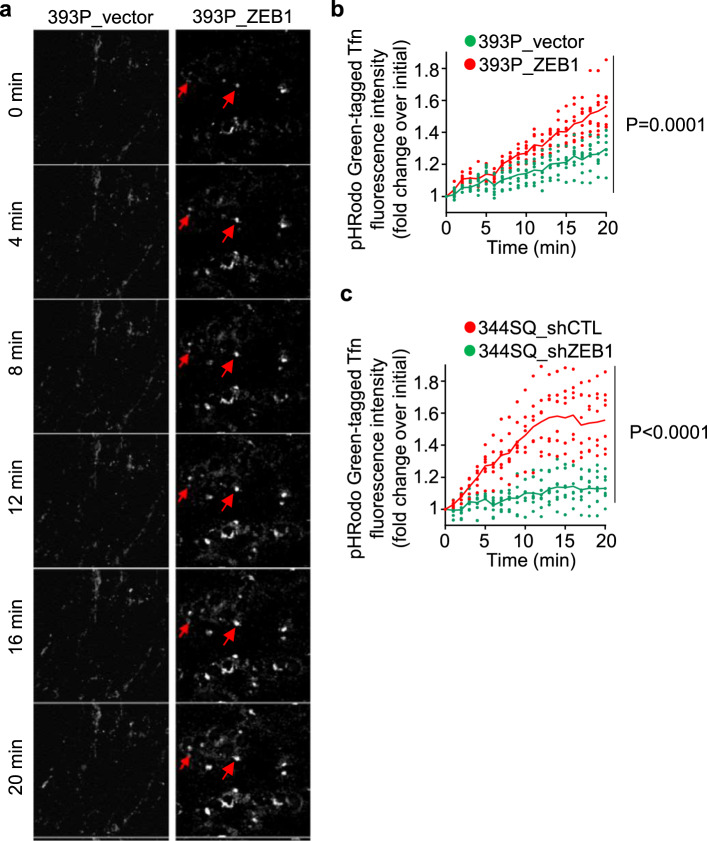
Fig. 4. ZEB1 accelerates endosomal acidification.
a Montage of live-cell confocal microscopic images of 393P cells that have ectopic expression of ZEB1 or empty vector and were treated with pHRodo Green-tagged Tfn. Gains in signal intensity over time (red arrows) mark vesicles that have reduced intravesicular pH and enhanced maturation. Scale bars, 10 µm. b, c Quantification of pHRodo Green-tagged Tfn signal intensities following ZEB1 gain-of-function (b) or ZEB1 loss-of-function (c). Signal intensities in each cell (dot) determined at each time point after pHRodo Green-tagged Tfn treatment initiation. n = 8 cells from 4 independent experiments. P values, two-way ANOVA.

