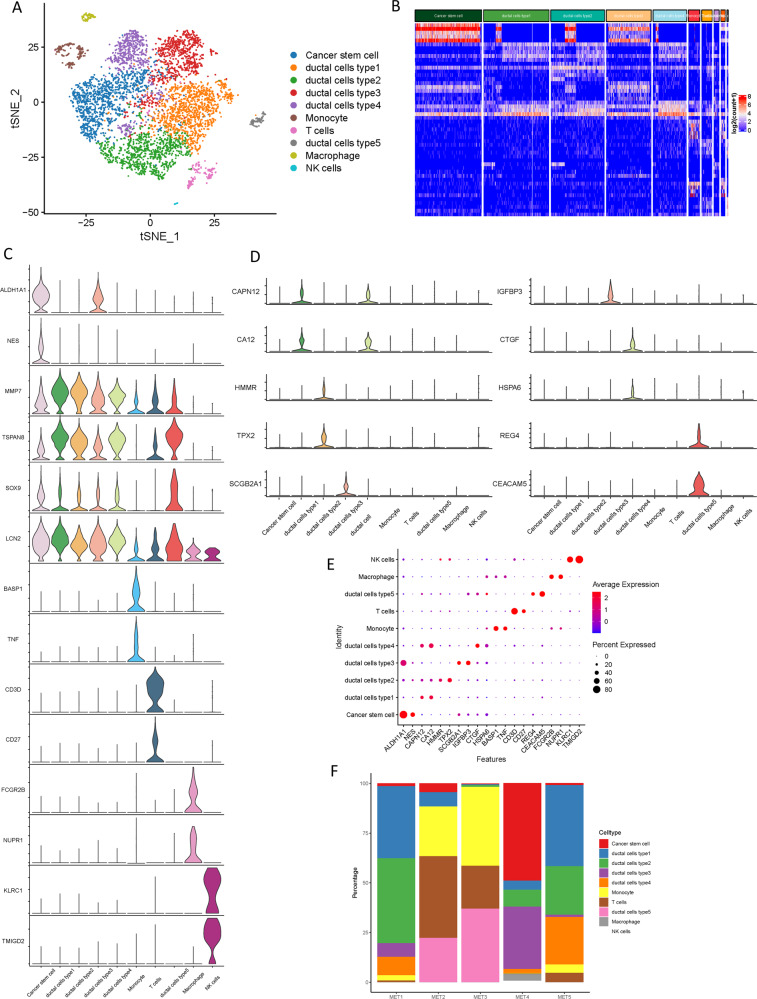
Fig. 1. Single-cell transcriptomic analysis of metastatic PDAC lesions.
A The t-distributed stochastic neighbor embedding (t-SNE) plot of the 10 identified main cell types in metastatic PDAC lesions. B Heatmap of top 5 DEGs among the myeloid cell subtypes, where the colors from red to blue represented alterations from high expression to low expression. C Violin plots showing the normalized expression levels of 14 representative canonical marker genes across the 10 clusters. D Violin plots showing the expression level of representative novel identified markers across the main cell types. E Dot plots showing the 20 signature gene expressions across the 10 cellular clusters. The size of dots represents the proportion of cells expressing the particular marker, and the spectrum of color indicates the mean expression levels of the markers (log1p transformed). F Relative proportion of each cell cluster across 5 metastatic PDAC lesions as indicated.

