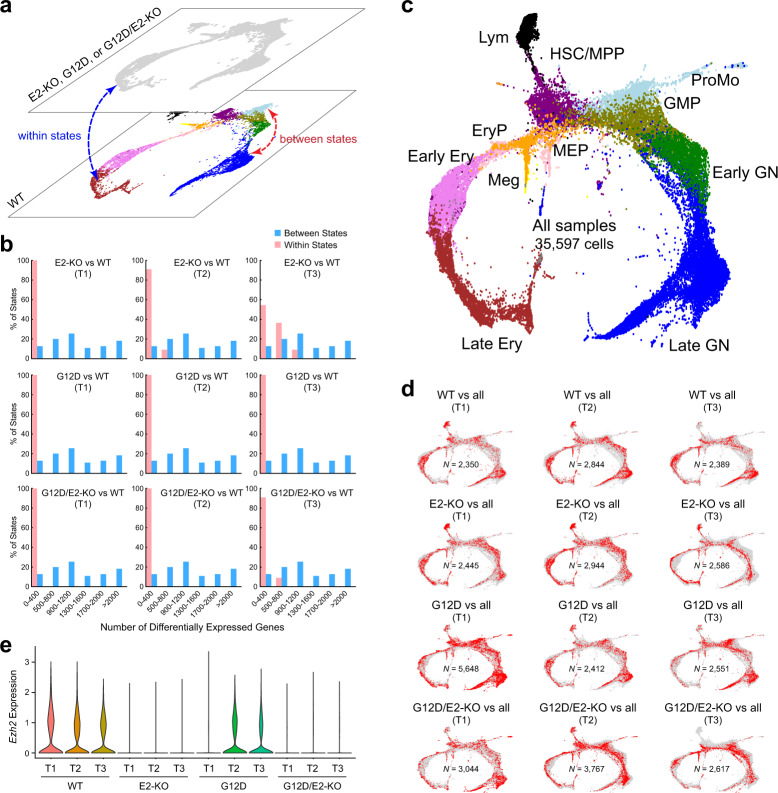
Fig. 2. Identification of cellular composition in mutant HSPCs.
a Annotation of cell populations in mutant HSPCs. The cell state for each cell from E2-KO, G12D, or G12D/E2-KO mutant HSPCs was annotated based on the cell state of their nearest neighbor in WT HSPCs. The differentially expressed genes (DEGs) between WT and mutant HSPCs within the same cell state (within states) or between states within the same genotype (between states) were identified by Wilcoxon rank sum test (adjusted P value < 0.01). b Number of DEGs within and between cell states. Histograms show the numbers of DEGs between WT and mutant HSPCs within each cell state (red) or between different cell states (blue). c KNN visualization of all single cells by combining 12 samples. Each dot represents a single cell. Cells are colored by cell-type annotations. d KNN visualization of single cells from each sample. Each plot shows cells from the indicated genotype and time point (red) against all cells from other genotypes and time points (gray). e Violin plot is shown for Ezh2 mRNA expression in WT or mutant HSPCs at different time points (T1–T3).

