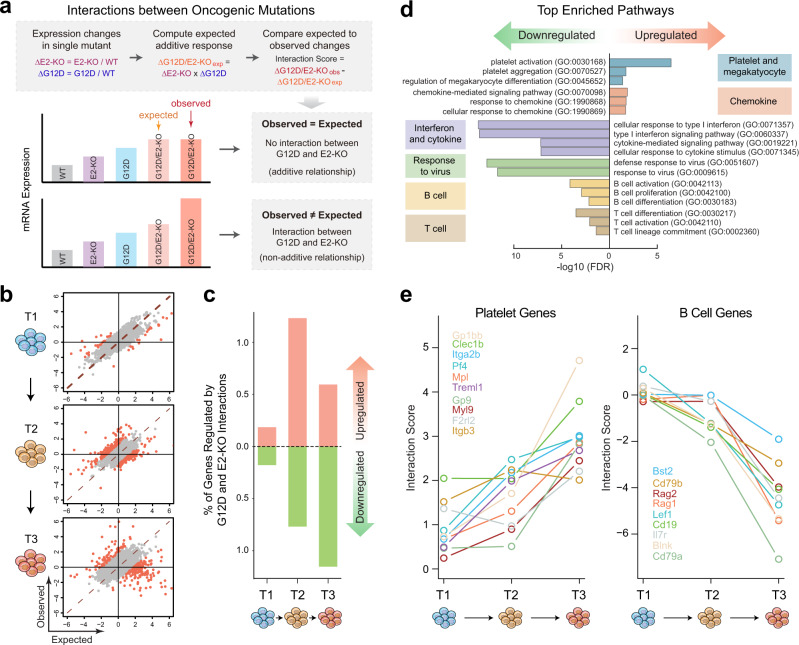
Fig. 5. Synergistic regulation of gene expression by cooperating oncogenic drivers in leukemia-initiating cells.
a Schematic of the analysis of interactions between E2-KO and G12D based on the observed and expected gene expression changes in HSPCs containing single or double mutations. b Scatter plots are shown for the observed and expected gene expression changes in G12D/E2-KO HSPCs at three-time points (T1–T3). Each dot represents a single gene. Red dots indicate significantly perturbed genes by the interactions between G12D and E2-KO. c The frequencies of genes regulated by G12D and E2-KO interactions are shown at each time point. Upregulated genes were affected by the synergistic interactions of G12D and E2-KO, whereas the downregulated genes were affected by the antagonistic interactions of G12D and E2-KO. d The top enriched functional pathways regulated by G12D and E2-KO interactions. The y-axis shows the GO terms for the enriched pathways, and the x-axis shows the negative log10 (FDR). e Interaction scores for platelet (left) and B cell genes (right) at different time points in G12D/E2-KO HSPCs are shown.

