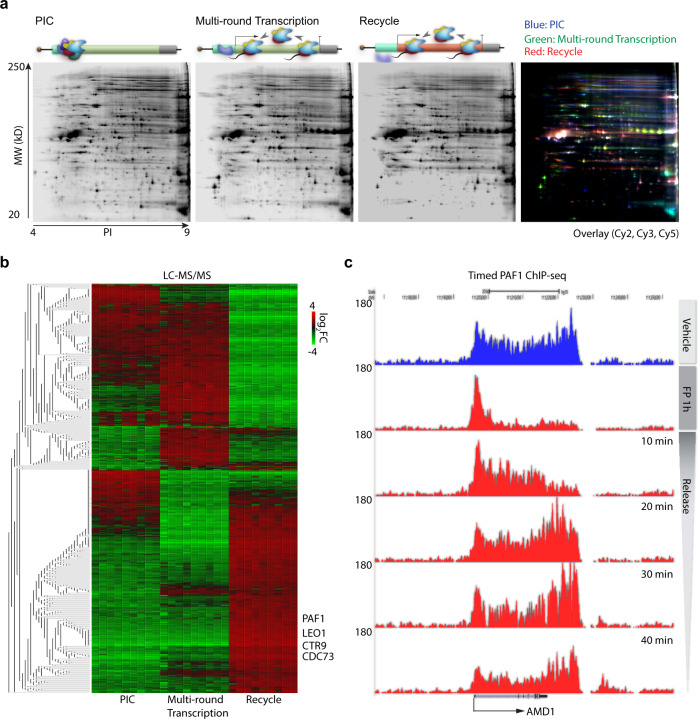
Fig. 2. Profiling of in vitro transcription on the sequential template.
a Representative two-dimensional gels showing proteins bound to the sequential template in individual transcription steps. b Heatmap showing profiling of proteins identified by LC-MS-MS/MS across all individual transcription steps on the sequential template. c UCSC Genome Browser views of a representative PAF1 time course ChIP-seq in LNCaP-abl cells. Source data are provided as a Source data file.

