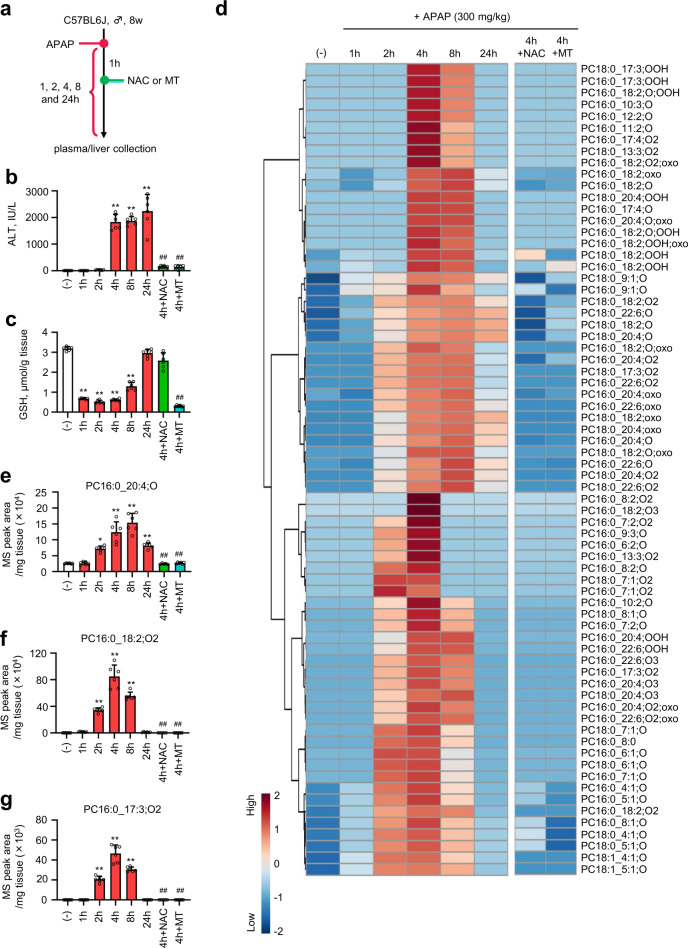
Fig. 3. Exhaustive analysis of endogenous oxPCs in APAP-treated mice.
a Experimental setup. Plasma and liver samples were collected 1, 2, 4, 8, and 24 h after APAP (300 mg/kg in saline) administration. One hour after APAP injection, the mice intraperitoneally received NAC (500 mg/kg body weight) or MT (20 mg/kg body weight) as antioxidants for liver injury suppression. b Plasma ALT level. c Total GSH level in the liver. d Heat map showing time-dependent profiles of endogenous oxPCs in lipid extracts from the liver of APAP-treated mice (300 mg/kg in saline). The color reflects normalized MS peak area of each oxPC using log10transformation and autoscaling. e–g MS peak areas of typical endogenous oxPCs formed after APAP injection. PC16:0_20:4;O (e), PC16:0_18:2;O2 (f), and PC16:0_17:3;O2 (g). Individual MS peak areas were normalized by the wet weight of the liver tissues. LC/HRMS/MS data were obtained by using PRM in the negative ion mode. Data are presented as mean + standard deviation of experiments repeated five or six times. In b, c, n = 6 was used for each group. In e–g, n = 5 was used for the 4 h + NAC group, n = 6 was used for (−), 1, 2, 4, 8, 24, and 4 h + MT group). P value was determined by the one-way ANOVA with the Tukey’s multiple comparison test. *P = 0.0005, **P < 0.0001, compared with the vehicle-treated group. ##P < 0.0001, compared with the APAP-treated group (after 4 h). Source data are provided as a Source Data file.

