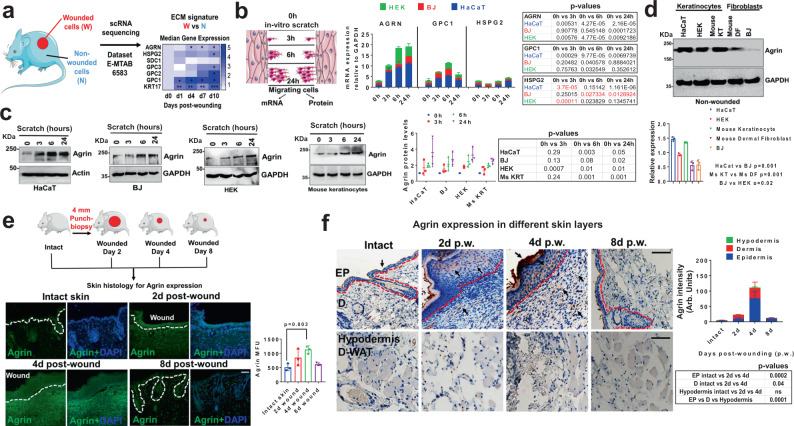
Fig. 1. Agrin expression is enhanced during mechanical injury to the skin.
a Work-flow of gene-expression analysis of an ECM-based wound signature from single-cell transcriptomics of wounded versus non-wounded mouse keratinocytes (two-tailed Students ‘t’ test, AGRN *p = 0.05, 0.01; HSPG2, p = 0.15; SDC1 **p = 0.0003; GPC3 p = 0.4; GPC2 p = 0.15; GPC1 *p = 0.01, 0.02; KRT **p = 0.004, 0.002 and ***p = 0.0002). b Confluent cells were scratched and allowed to migrate. After indicated time-points, mRNA isolated from migrating cells were analyzed by RT-PCR for the indicated genes. Data represented as mean +/− s.d., two-stage Benjamini procedure Multiple t-tests; p values in tabular form (red values signify reduction). c Western blot analysis of migrating skin cells (as in panel b) for Agrin expression. GAPDH was used as loading controls. Densitometric quantification of Agrin levels in the indicated cells is shown graphically. Data represented as mean +/− s.d. (n = 3 experiments, two-stage Benjamini Multiple t-tests, p values shown in the figure). d Western blot analysis in non-wounded skin keratinocytes and fibroblasts for the indicated proteins. GAPDH was used as loading controls. Densitometric quantification of Agrin bands are presented as mean +/− s.d. (n = 3 experiments, **p = 0.001, *p = 0.02, two-tailed Students ‘t’ test). e Schematic showing the testing of Agrin expression in mouse skin post-wounding. Confocal microscopy sections of mouse skin punch-wound biopsies at indicated days were analyzed for Agrin immunofluorescence and counterstained with DAPI. Scale: 50 μm. Mean fluorescence intensity (MFU) of Agrin staining in the mouse skin sections is represented as mean +/− s.d. (n = 3 mice, three sections, **p = 0.003, two-tailed Students ‘t’ test). The white dashed line denotes the epidermis and dermis boundaries. f Agrin immunohistochemistry of mouse skin punch-wound biopsies at indicated day post-injury. Scale: 100 μm, EP-Epidermis, D-Dermis, d-WAT-Dermal White adipose tissue. The red dotted line denotes the epidermal-dermal boundary. Agrin intensity is represented as mean +/− s.d. (n = 3 mice, three sections analyzed for each time-point, two-tailed paired t-tests, p values in the figure).

