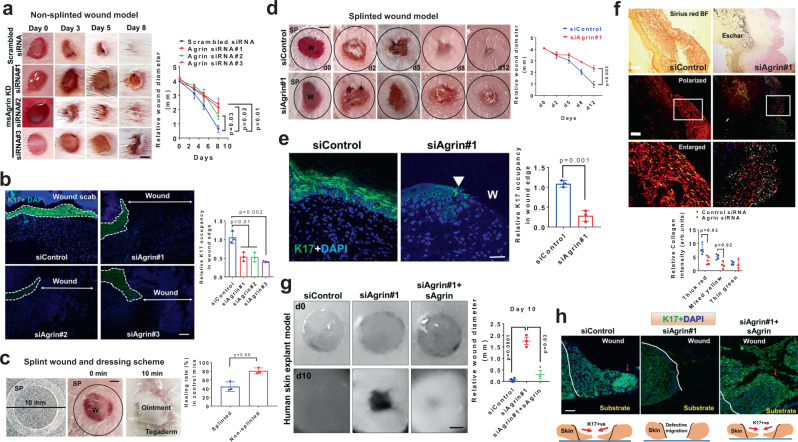
Fig. 2. Agrin depletion impairs skin wound healing.
a Representative photographs of mouse wounds at the indicated days of treatment with siRNA containing ointments. Wound diameter presented as mean +/− s.e.m. (n = 4 mice per group, Two-way ANOVA, *p = 0.02, 0.03 and 0.01, respectively) on indicated days post-wounding. Scale: 1 mm. b Confocal microscopy images showing K17 and DAPI staining at day 5 post-wounding in the mouse skin sections treated as in (a). Scale: 50 μm. Relative K17 staining intensity represented as mean +/− s.d. (n = 3 sections per group, Students ‘t’ test, two-tailed, p = 0.01, p = 0.002, respectively). c Photographs showing splinted wound dressing scheme. Wound diameter at day 7 in splinted and non-splinted conditions were quantified as mean +/− s.d. (n = 3 mice in each group, *p = 0.05, two-tailed Students ‘t’ test). d Representative photographs of mouse splinted wounds are shown at indicated days of siRNA ointment applications. Wound diameter represented as mean +/− s.e.m. (n = 3 mice per group, one-way ANOVA p = 0.003). SP denotes splint. Scale: 1 mm. e Confocal images showing K17 and DAPI staining at day 7 post-wounding in the mouse skin treated with the indicated siRNAs. Scale: 50 μm. The white block arrow indicates the attenuated epithelial tongue. Relative K17 occupancy represented as mean +/− s.d. (n = 3 sections per group, two-tailed Students ‘t’ test, p = 0.001). f Collagen distribution in the wound beds of control and Agrin siRNA treated mouse skin at day 7. Bright-field and polarized light images are shown. The boxed area represents the enlarged view. Scale: 100 μm. The relative collagen fibers were presented as mean +/− s.d. (n = 4 sections analyzed from 3 mice per group, two-tailed Students ‘t’ test, *p = 0.02). g Representative photographs of human skin explants at days 0 and 10 post-wounding. Wound diameters at day 10 are presented as mean +/− s.d. (n = 3 per group, two biological repeats, two-tailed Students ‘t’ test, ***p = 0.0001, *p = 0.03, respectively). Scale: 0.5 mm. h Confocal images showing K17 staining in the skin explants of control, Agrin depleted, and those rescued by sAgrin (n = 3 sections per group from three explants, repeated twice). The red arrow marks the leader keratinocytes. The white line indicates the wound boundary. Scale: 50 μm.

