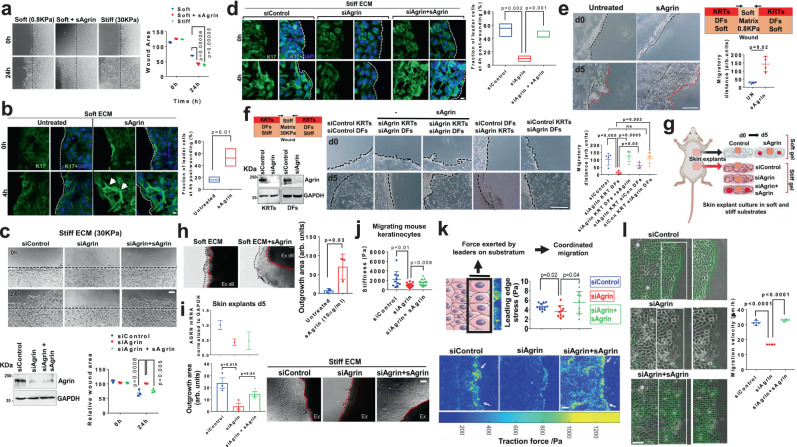
Fig. 3. Agrin sensitizes rigidity-dependent keratinocytes migration by enhancing traction and velocity.
a Bright-field images of HaCaTs on soft or stiff substrates with/without sAgrin for 18 h. Wound area presented as mean +/− s.d. (n = 3, Benjamini Multiple-t test, p = 0.00006, 0.00005). Scale: 50 μm. b Confocal images showing K17 and DAPI in HaCaTs as in (a). Scale: 10 μm. K17 intensity was quantified (n = 10 per group, Students ‘t’ test, *p = 0.01, bars-1-99 percentile, central lines-median). White arrows- leader cells. Dashed line-wound edge. c Bright-field images of control, Agrin depleted or rescued HaCaTs on 30 KPa. Migratory area quantified as mean +/− s.d. (n = 3, Two-way ANOVA). Scale: 50 μm. Western blot showing Agrin knockdown. d Confocal images of K17 and DAPI in cells treated same as in (c). Scale: 10 μm. Dashed line shows wound edge. K17 intensity is quantified (n = 10 per condition, Students ‘t’ test, **p = 0.002, p = 0.001, Box-1-99 percentile, lines-median). e Schematic and bright-field images of 3D-migration with/without sAgrin on 0.8 KPa. Scale: 100 μm. (n = 4 per group, Students ‘t’ test, *p = 0.02). Black lines-original wound; red-migrated region. f Western blot showing Agrin knockdown in cells used for 3D-migration. Bright-field images of migratory cells with/without sAgrin on stiff matrix. Scale: 100 μm. Migration area presented as mean +/− s.d. (n = 4 per group, Students ‘t’ test, p = 0.05, 0.005, 0.002, 0.0005). g Mouse skin explant set-up. h, i Bright-field images of keratinocytes on 0.8 KPa with/without 20 μg/ml sAgrin (h). Skin explants in control, Agrin depleted or conditioned with sAgrin on 30KPa (i). RT-PCR for Agrin (i) is shown as mean +/− s.d. (n = 3 repeats). Outgrowth area represented as mean +/− s.d., n = 3 per group, Students ‘t’ test, *p = 0.03 (h), *p = 0.019 and 0.04 (i). Scale: 50 μm. AFM (j) and TFM (k) in Control HaCaTs, Agrin depleted and those rescued with sAgrin at 4 h post-wounding. j Mean stiffness (Pascals) +/− s.d. are shown (n = 10 cells, three replicates, Students ‘t’ test, *p = 0.01, *p = 0.008). White arrows-leading edge. Scale: 100 μm. k Traction forces shown as mean +/− s.d. (n = 6 images, three experiments, Students’t’ test, *p = 0.02 and 0.04). l PIV in HaCaTs treated as in (j). Green arrows-velocity. White asterisks-vortex. Scale: 100 μm. Velocities presented as mean +/− s.d. (n = 3, Students ‘t’ test, ***p = 0.00001). Statistics are all two-tailed.

