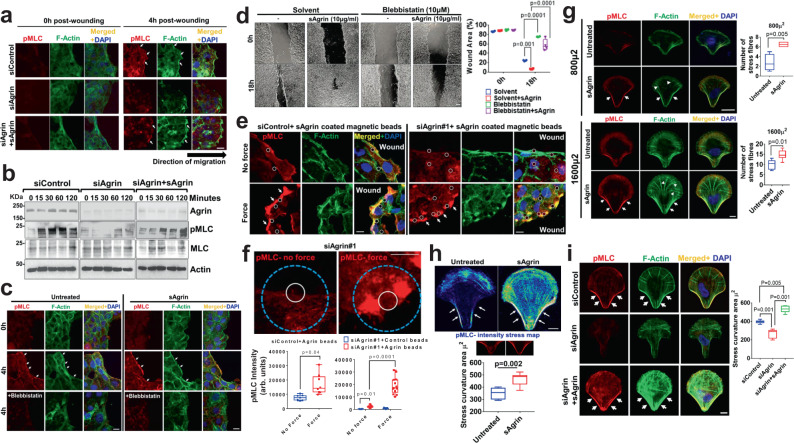
Fig. 4. Agrin tunes cell mechanics during wound injury.
a Confocal images showing pMLC and F-Actin staining in control HEK, Agrin depleted and rescued with 10 μg/ml sAgrin at the indicated time post-scratch. Scale: 10 μm. White arrows show acto-myosin cables. b Western blot analysis in HEK treated as in (a) post-scratch injury after the indicated time (n = 3 biological repeats). c, d Confocal images of pMLC, F-Actin, and DAPI in untreated or sAgrin nourished HEK in the presence or absence of blebbistatin treatment (2 h). Scale: 10 μm (c). Bright-field images of migrating cells at 18 h post-scratch (d). Wound area is plotted in box-whiskers (n = 3, two-tailed Students ‘t’ test, **p = 0.001, ***p = 0.0001 respectively, Box-1-99 percentile, whiskers- minimum to maximum, central line-median). Scale: 100 μm. e Confocal images showing pMLC, F-Actin, and DAPI staining under normal or magnetic force-recognition by BSA or sAgrin beads in Control and Agrin depleted HEKs. Scale: 10 μm. White circles indicate beads. White arrows indicate pMLC-Actin cables. f Mean pMLC intensity around sAgrin beads in Agrin depleted HEK cells presented from three experiments (n = 8 cells, two-tailed Students ‘t’ test, *p = 0.04, ***p = 0.0001, Box-1-99 percentile, whiskers-minimal to maximum values, central line-median). Scale: 10 μm. The white circle indicates beads. The blue circle represents 200 μ2 area around each bead. g Representative confocal images of indicated HEKs in small or large micropatterns with/without 20 μg/ml sAgrin for 4–6 h showing pMLC and F-actin distribution with DAPI. Stress fiber was quantified as mean +/− s.d. from three experiments (n = 10 cells per group, two-tailed Students ‘t’ test, **p = 0.005, *p = 0.01, respectively, Box-1-99 percentile, whiskers- minimum to maximum values, central line-median). Scale: 10 μm. h Confocal images of pMLC intensity of HEKs on large fibronectin or sAgrin-coated micropatterns. Scale: 10 μm. Stress curvature is presented from three experiments (n = 10 cells per group, two-tailed Students ‘t’ test, **p = 0.002, Box-1-99 percentile, whiskers-minimum to maximum values, central line-median). i Confocal images of Control or Agrin depleted HEKs cultured same as in (h) were immunostained with pMLC and F-actin with DAPI. Scale: 10 μm. Stress curvature presented from three experiments (n = 10 cells per group, two-tailed Students ‘t’ test, **p = 0.001, **p = 0.005 Box-1-99 percentile, whiskers- minimum to maximum values, central line-median).

