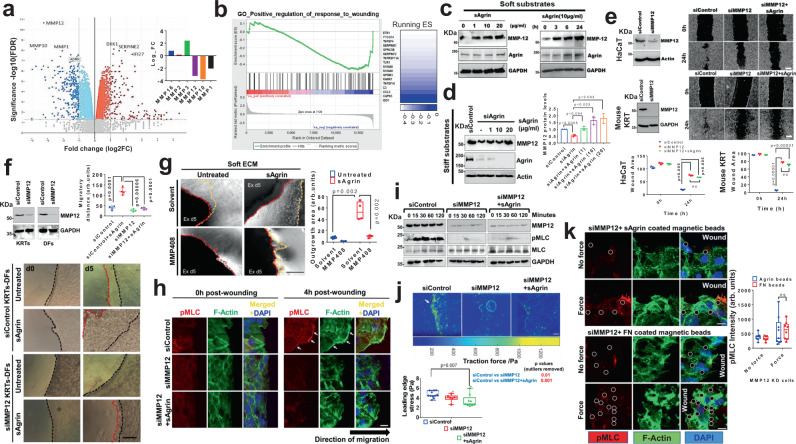
Fig. 5. MMP12 potentiates Agrin’s mechanoperception.
a Volcano plot of differentially expressed genes in si-control and si-Agrin HaCaTs. Inset showing MMP genes. (n = 3 replicates). b GSEA showing the downregulated gene cluster. c Western blot for the indicated proteins from HaCaT cells on 0.8 KPa under varied sAgrin concentrations for 18 h (left) or 10 μg/ml sAgrin for the varying time (right). d Western blot for the indicated proteins in control, Agrin depleted and rescued HaCaT on 30 KPa. MMP12 bands were quantified as mean +/− s.d. (n = 3, Two-stage, Holm−Sidak Multiple t-tests). e Western blot detecting MMP12 levels in indicated cells. Bright-field microscopy images of same cells post-scratch assay. Wound area presented as mean +/− s.d. (n = 3, two-tailed Students ‘t’ tests, **p = 0.005, ***p = 0.0001, respectively). Scale: 50 μm. f Western blot showing MMP12 knockdown (n = 2). Bright-field images of control and si-MMP12 cells migrating with/without 10 μg/ml sAgrin on 0.8KPa. Scale: 100 μm. Black and red dotted lines show the initial wound and end-migrated areas. Migration area was quantified as mean +/− s.d. (n = 4 wounds, two-stage Benjamini Multiple ‘t’ tests, ***p = 0.0001 and ****p = 0.00006). g Mouse skin explants on 0.8 KPa with/without 20 μg/ml sAgrin were treated with DMSO or MMP408 (5 nM). Bright-field images showing outgrowth on day 5. Scale: 50 μm. Outgrowth area was quantified (n = 4 per group, Two-tailed Students ‘t’ test, **p = 0.002, Box-1-99 percentile, whiskers-minimum to maximal values, central line-median). h Confocal images showing p-MLC, F-Actin, and DAPI staining in control or MMP12 silenced HaCaTs in the presence or absence of sAgrin. Scale: 10 μm. White arrows show actomyosin cables. i Cell lysates from HEK treated as in (h) were analyzed by Western blot (n = 3 repeats). j traction force map in control and si-MMP12 HaCaTs with/without sAgrin (10μg/ml) for 18 h. Scale: 100 μm. Mean traction stress (in Pascals) are shown (n = 6 images from three experiments, two-tailed Students’t’ test, *p = 0.007, Box- 1-99 percentile values, whiskers- minimum to maximum, central line-median). k Confocal images showing pMLC-F-Actin and DAPI staining upon sAgrin/Fibronectin-induced force in MMP12-depleted HaCaTs. Scale: 10 μm. White circles represent beads. Mean pMLC intensity +/− s.d. was quantified from three experiments (n = 10 cells per group, two-tailed Students ‘t’ test, ns, Box-1-99 percentile, whiskers- minimum to maximum values, central line-median).

