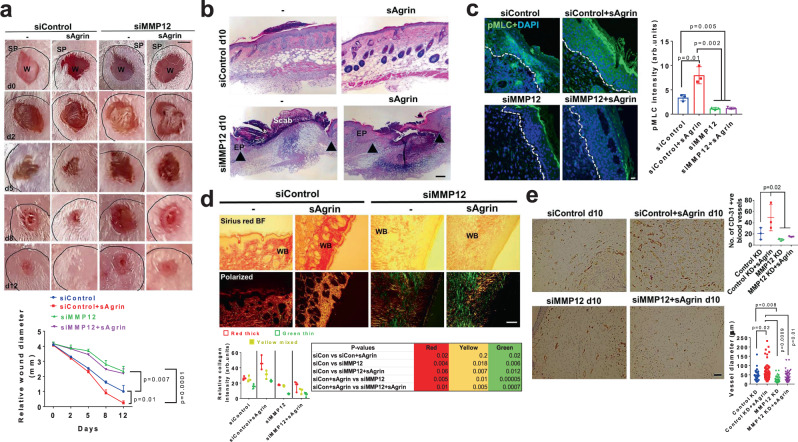
Fig. 6. MMP12 is required for sAgrin-induced wound healing in vivo.
a Representative photographs of control or MMP12 silenced splinted mouse skin wounds at indicated days either untreated or treated with 200 μg of sAgrin. Scale: 1 mm. The wound diameter at indicated days is quantified as mean +/− s.e.m. (n = 3 mice per group, two-way ANOVA, *p = 0.007, *p = 0.01, ***p = 0.0001, respectively). SP indicates splint. b Representative Haematoxylin and Eosin stained sections of mouse skin receiving the combinations of siRNA treatments as in panel (a) at day 10 post-wounding. Region encoded by black arrows represents the unhealed area (n = 3 sections from three mice per condition, repeated twice). Scale: 100 μm. c Representative confocal images showing the pMLC staining in control and MMP12 depleted mouse skin in the absence or presence of sAgrin treatments. Scale: 10 μm. The pMLC intensity was quantified as mean +/− s.d. (n = 3 mice sections per group, two-tailed Students ‘t’ test, *p = 0.01, **p = 0.005 and 0.002, respectively). d Picrosirius red staining images of indicated mouse skin sections at day 10 post-wounding. Representative bright-field and polarized views are presented. Scale: 100 μm. WB denotes wound bed. The collagen fibers distribution was presented as mean +/− s.d. (n = 3 sections per group, two-tailed Students ‘t’ test, p values presented in the table). e Assessment of angiogenesis by CD-31 immunohistochemistry in control and MMP12 deficient mouse skin wound beds in the presence or absence of sAgrin treatment at 10 days post-injury. The number of blood vessels and their diameter are represented as mean +/− s.d. (n = 3 mice per group, at-least 30 blood vessels from each image from three mice per group were analyzed, One-way ANOVA, *p = 0.02, two-tailed Students t-tests, *p = 0.02, p = 0.01, p = 0.008, **p = 0.0009, respectively). Scale: 100 μm.

