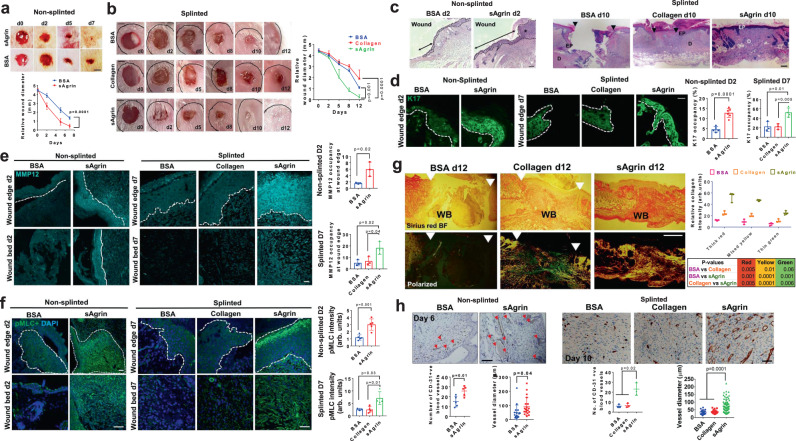
Fig. 7. Accelerated skin wound healing by sAgrin-based topical biomaterial.
Representative photographs showing the wound areas in mice receiving the indicated treatments at respective days under non-splinted (a) or splinted (b) conditions. Scale: 1 mm. Mean wound area +/− s.e.m. is shown (n = 4 mice per group, Two-way ANOVA, p = 0.0001, p = 0.001, p = 0.0001, respectively). c Hematoxylin and Eosin stained bright-field images of control and sAgrin wound sections at day 2 (n = 3 sections from three mice per group, two experiments). Asterisk (*) denotes the migrating keratinocytes. The black arrow (non-splinted) shows the migrating keratinocytes. The black arrows (splinted) present the area left unhealed at day 10 post-wounding. Scale: 100 μm. d Confocal images showing K17 occupancy in the mouse skin wounds receiving BSA, Collagen, or sAgrin treatments in non-splinted (at day 2) or splinted conditions (at day 7). Relative K17 intensity is presented as mean +/− s.d. (n = at-least three sections analyzed from 3 mice per group, two-tailed Students ‘t’ test, *p = 0.01, **p = 0.005, ***p = 0.0001, respectively). Representative confocal images showing MMP12 (e) and pMLC (f) at the wound edges and beds of mouse skin receiving treatments at day 2 (non-splinted) or day 7 (splinted) post-injury. Relative staining intensities are presented as mean +/− s.d. from three sections from three mice (two-tailed Students ‘t’ test, *p = 0.02, p = 0.04, p = 0.03, p = 0.01, and ***p = 0.001, respectively). Scale: 100 μm. The dashed white line separates the epidermis from dermis regions. g Picrosirius red-stained images of BSA, Collagen, and sAgrin treated mouse skin sections (splinted model) at day 12 post-wounding. Scale: 100 μm. WB denotes wound bed. White arrows represent the unhealed area. The collagen fibers were quantified as mean +/− s.d. (n = 3 sections from three mice per group, two-tailed Students ‘t’ test). h CD-31 immunohistochemistry in BSA, Collagen, and sAgrin treated mice skin at indicated days. Red arrows denote blood vessels. The number of blood vessels and their diameter are represented as mean +/− s.d. (n = at-least 3 sections analyzed from three mice per group, two-tailed Students ‘t’ test, *p = 0.01, *p = 0.04, One-way ANOVA *p = 0.02, and ***p = 0.0001, respectively). Scale: 100 μm (non-splinted) and 50 μm (splinted).

