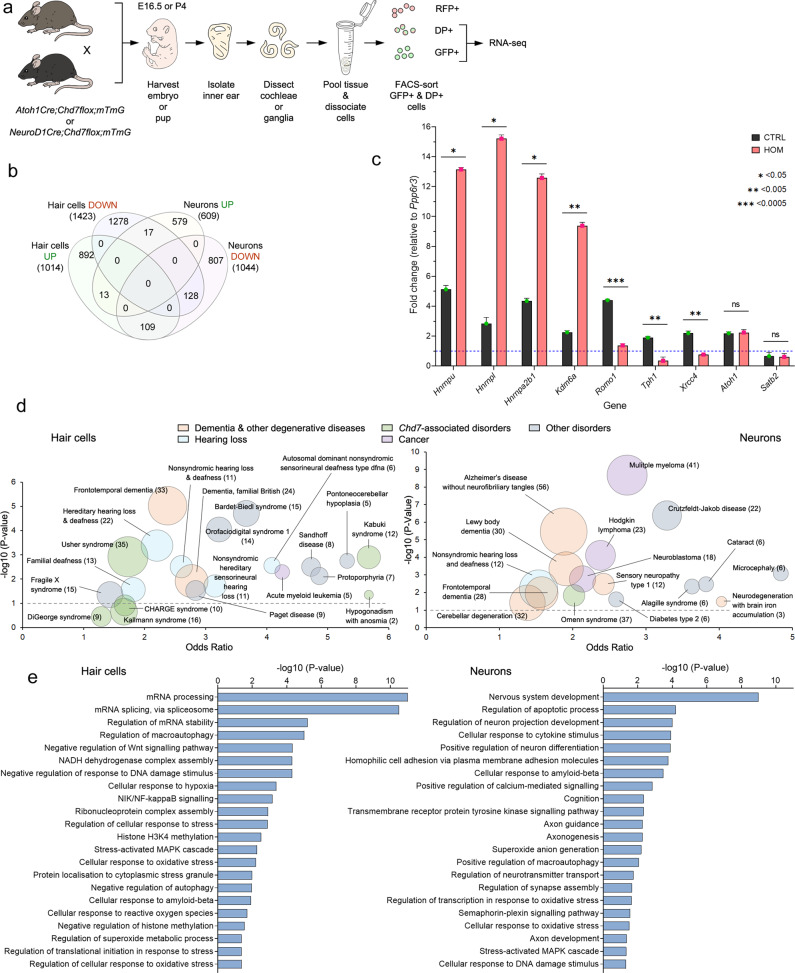
Fig. 5. Transcriptome analysis of control and Chd7 mutant hair cells and neurons reveals misregulation of cellular stress pathways.
a Schematic showing the experimental approach used for RNA sequencing. DP = double positive. n = 6 cochleae or ganglia were pooled for RNA-seq in three independent experiments per genotype. b Comparison of the number of differentially expressed genes between hair cells and neurons in homozygotes. c qPCR expression analysis of genes in controls and homozygous FAC-sorted hair cells at E16.5. Error bars represent the standard error. P-values: *= < 0.05, **< 0.005, ***< 0.0005. ns = not significant. d Plot of Odds ratio by −log10 of the P-value for human diseases identified by disease ontology. Odds ratio is used to determine the relative odds of the occurrence and magnitude of disease, given exposure to the risk factor (e.g., genes). Complete disease ontology is provided in Supplementary Data 5 and 6. e Gene ontology for differentially regulated genes. Complete gene ontology is provided in Supplementary Data 7 and 8.

