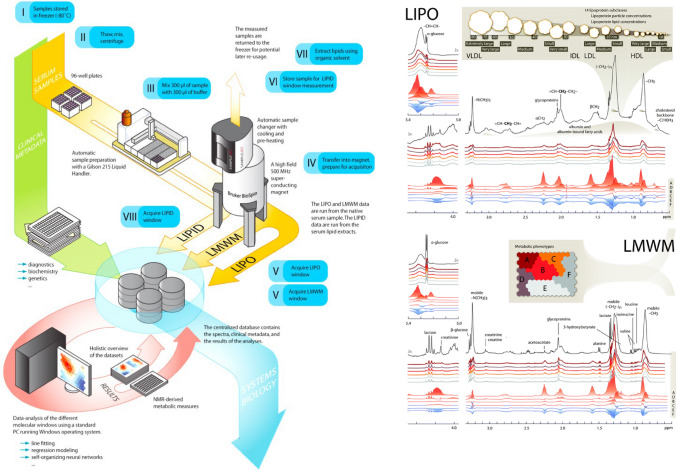
Figure 1.
Summary of NMR spectroscopy method. The NMR spectroscopy methodology utilises approach uses three molecular windows, (two that were applied to native serum and one to serum lipid extracts requiring minimal preparation) to quantify the 148 metabolic traits. The NMR-based metabolite quantification is achieved through measurements of three molecular windows from each serum sample. Two of the spectra (LIPO and LMWM windows) are acquired from native serum and one spectrum from serum lipid extracts (LIPID window). The NMR spectra are measured using Bruker AVANCE III spectrometer operating at 500 or 600 MHz. Measurements of native serum samples and serum lipid extracts are conducted at 37 °C and 22 °C, respectively. The LIPO window represents a standard spectrum of human serum displaying broad overlapping resonances arising from lipid molecules in various lipoprotein particles. The LIPO data are recorded using 8 transients acquired using a NOESY-presat pulse sequence with mixing time of 10 ms and water peak suppression. The LMWM window includes signals from various low-molecular-weight molecules. The LMWM spectrum is recorded using a relaxation-filtered pulse sequence that suppresses most of the broad macromolecule and lipid signals to enhance detection of small solutes. Specifically, a Carr–Purcell–Meiboom–Gill (CPMG) pulse sequence with a 78 ms T2-filter and fixed echo delay of 403 μs is applied using 24 transients. The LIPID window of the serum extracts is acquired with a standard 1D spectrum using 32 transients. QC and outputs The NMR spectra were analysed for absolute metabolite quantification (molar concentration) in an automated fashion. For each metabolite a ridge regression model was applied for quantification in order to overcome the problems of heavily overlapping spectral data. In the case of the lipoprotein lipid data, quantification models were calibrated using high performance liquid chromatography methods, and individually cross-validated against NMR-independent lipid data. Low-molecular-weight metabolites, as well as lipid extract measures, were quantified as mmol/l based on regression modelling calibrated against a set of manually fitted metabolite measures. The calibration data are quantified based on iterative line-shape fitting analysis using PERCH NMR software (PERCH Solutions Ltd., Kuopio, Finland). Absolute quantification cannot be directly established for the lipid extract measures due to experimental variation in the lipid extraction protocol. Therefore, serum extract metabolites are scaled via the total cholesterol as quantified from the native serum LIPO spectrum. Figure adapted from12.

