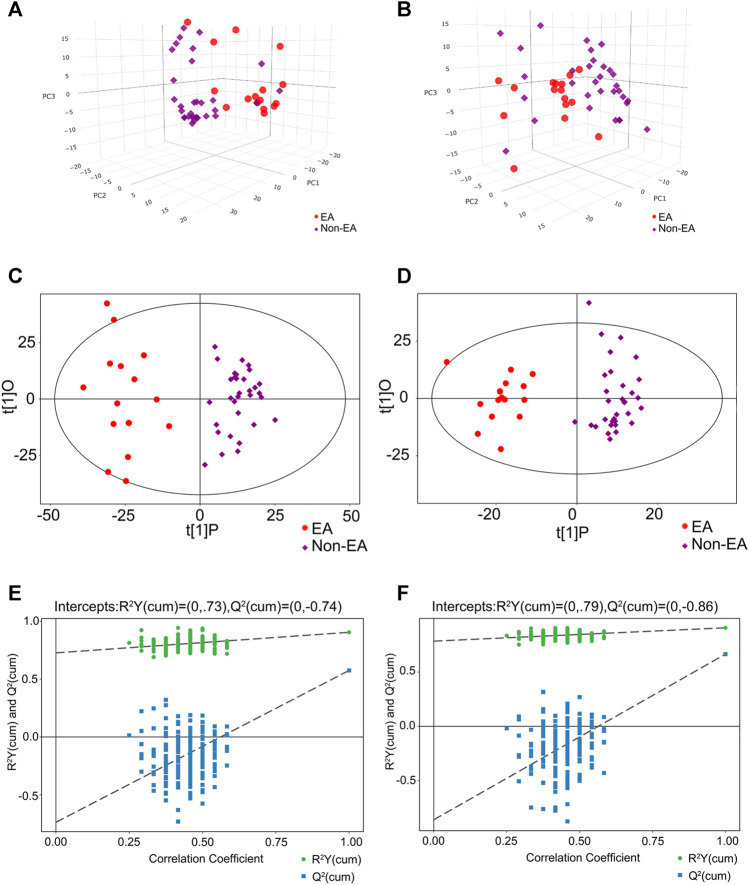
FIGURE 2.
Multivariable analysis and selection of discriminant variables with both positive and negative ion modes between the EA group and the non-EA group. The PCA analyses were demonstrated as (A) (the positive ion model) and (B) (the negative ion model) between the two groups. (C) and (D) revealed the OPLS-DA score plots with further permutation tests [(E) in the positive mode and (F) in the negative mode] between the two groups.

