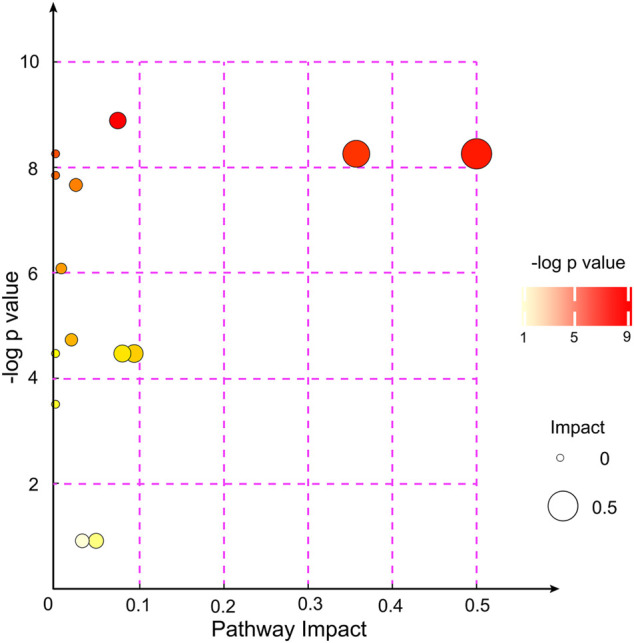
FIGURE 4.

KEGG pathway enrichment analyses of the 31 altered metabolites between the EA group and the non-EA group. Each bubble represented a pathway, and 14 pathways were included in this bubble plot. The bubble size indicated the impact factor of the pathway in the topology analysis, and the bigger the size, the larger the impact factor. The bubble color represented the enrichment degree, and the deeper the color, the smaller the p value, indicating more significant enrichment.
