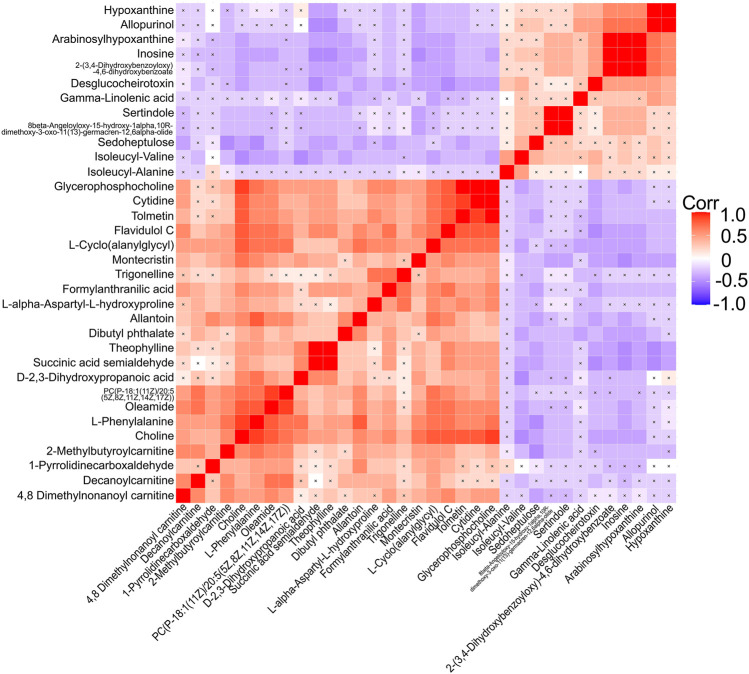
FIGURE 5.
Correlation analyses of differential metabolites between the EA group and the non-EA group. 34 altered metabolites (including 3 metabolites of benzenoids) listed in Table 3 were performed Pearson correlation analyses using a heat map. The positive and negative correlations were shown in red and blue, respectively. A cross mark indicated a nonsignificant correlation.

