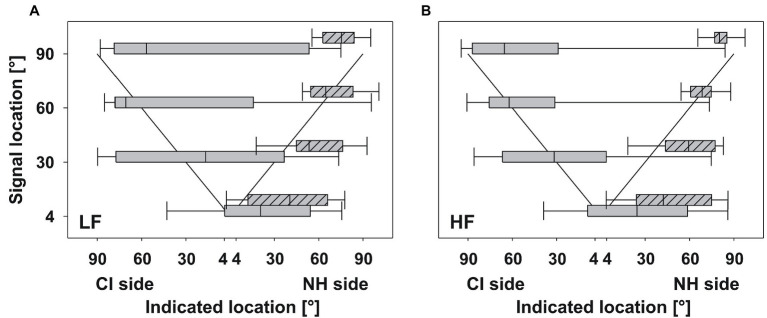
Figure 2.
Relative localization. The median across participants of indicated locations plotted against signal locations for (A) LF signals and (B) HF signals. For consistency across participants, results from the CI side are plotted on the left side of the abscissa, even if the CI was actually on the right side. The diagonal line shows 100% correct localization. Box plots show median (black line), 25th and 75th percentile (boxes), and 10th and 90th percentile (whiskers). Plain boxes indicate localized signals on the CI side, shaded boxes indicate localized signals on the NH side. On average, the group of SSD participants was able to localize the sounds, albeit with high variability.

