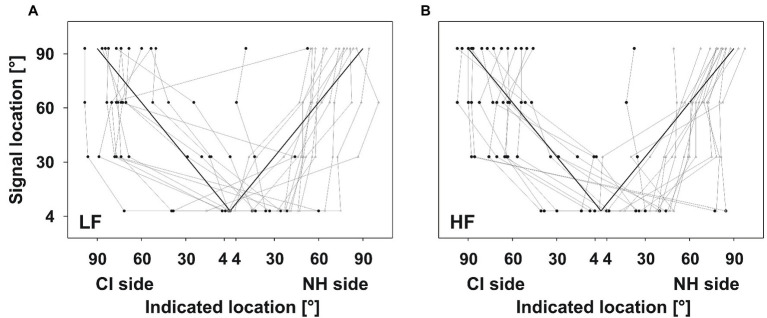
Figure 3.
Good performers. Indicated locations plotted against the signal location. Layout of the plots as in Figure 2. Symbols show the median of five signal presentations for every participant, separately. Black circles indicate signals presented on the CI side, whereas gray triangles indicate signals presented on the NH side. Participants were able to identify signals on the CI and on the NH side. Some of them showed a trend for correct localization from frontal to lateral signal locations.

