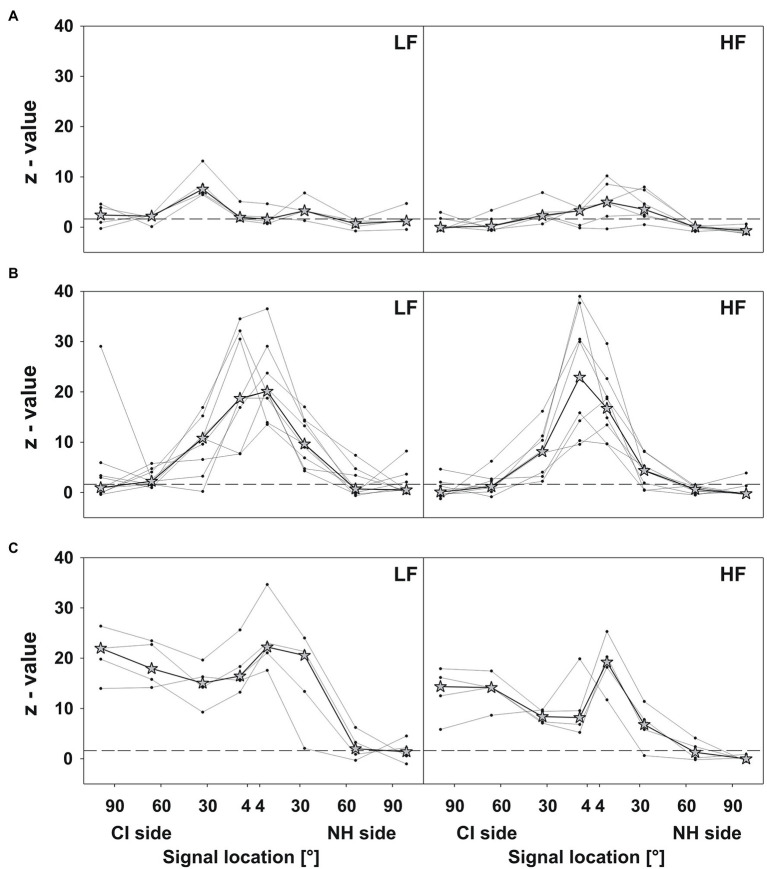
Figure 6.
Absolute localization. Z-values plotted against the signal location for LF (left panels) and HF (right panels) signals. The dashed lines depict the significance level (1.64). Dots depict the z-value compared to the actual sound source location for every participant, separately. Asterisks depict the respective median of the group. Three different response patterns were evident: (A) good performance (at least four z-values below or nearby 1.64), (B) reduced accuracy at frontal locations, and (C) reduced accuracy on the CI side.

