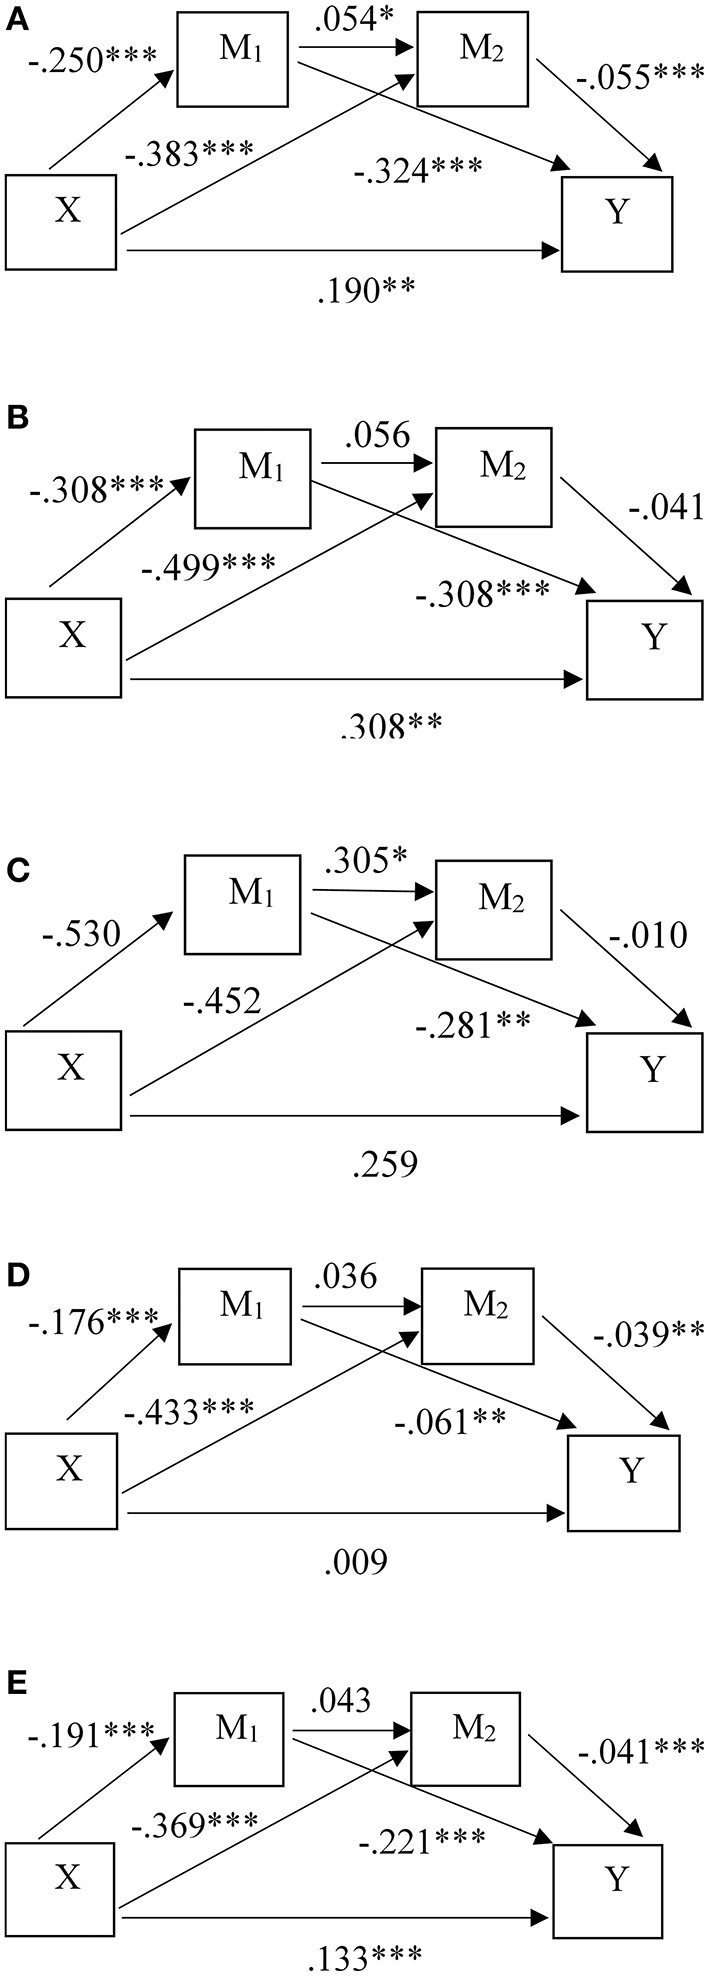
Figure 2.

Predictive model effects for the HE student groups: (A) all students (N = 2,480), (B) low academic stress students (N = 63), (C) high academic stress students (N = 839), (D) depressed students (N = 404), (E) non-depressed students (N = 2,076). *significant at p < 0.05, **significant at p < 0.01, ***significant at p < 0.001.
