Figure 1.
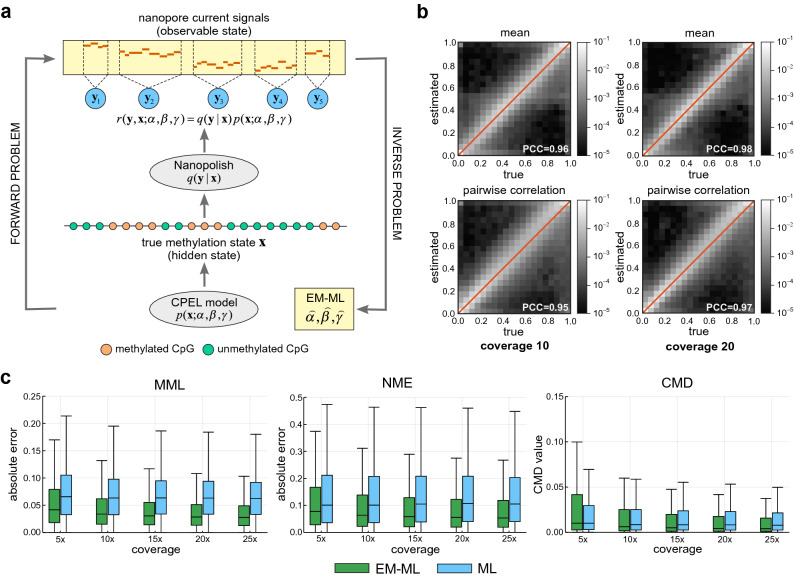
The CpelNano method and simulated performance evaluation results. (a) To consider nanopore noise, CpelNano employs a hidden Markov model (HMM) approach, which treats the true methylation state over an estimation region of the genome as a hidden state that is observed indirectly through a state of nanopore current signals. It then models the hidden state using a parametric correlated potential landscape model (CPEL) and addresses the forward problem of modeling the relationship between the observable and hidden methylation states using a data-generative model , which is expressed in terms of the CPEL model and emission probabilities computed using Nanopolish4. Finally, it solves the inverse problem of estimating values , , and for the unknown parameters of the CPEL model of the hidden methylation state from available nanopore data using an expectation-maximization based maximum-likelihood (EM-ML) approach. (b) Binned joined probability distributions and associated Pearson correlation coefficient (PCC) values between estimated and true means and pairwise correlations at individual CpG sites, obtained by using a simulation-based approach (Fig. S4). Results are shown for nanopore noise with standard deviation and data coverages of × and ×. A lighter region indicates a higher probability of association between estimated and true values. (c) Boxplots depicting distributions of absolute errors over analysis regions between estimated and true mean methylation level (MML) and normalized methylation entropy (NME) values, as well as distributions of coefficient of methylation divergence (CMD) values between the estimated and the true probability distributions of methylation. These quantities were computed by the EM-based maximum-likelihood (EM-ML) approach of CpelNano (green), as well as by fitting the CPEL model directly to the methylation calls made by Nanopolish4 using maximum-likelihood (ML; blue). Results are shown for nanopore noise with standard deviation and data coverages of ×, ×, ×, ×, and ×. Center line of box: median value; box bounds: 25th and 75th percentiles; lower whisker: larger of minimum value and 25th percentile minus × interquartile range; upper whisker: smaller of maximum value and 75th percentile plus × interquartile range.

