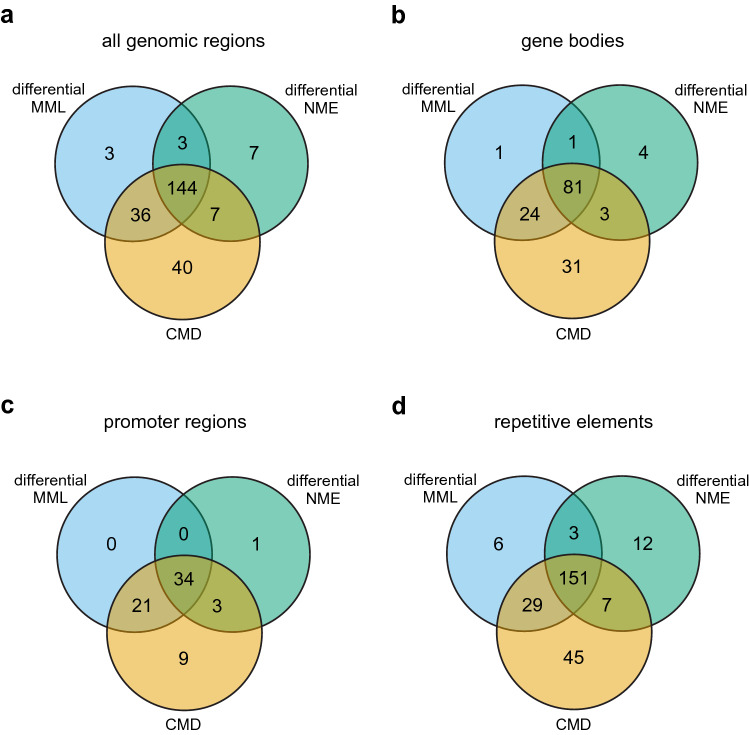
Figure 4.
Methylation discordance and analysis regions in the targeted breast normal/cancer comparison. (a) Venn diagram showing the number of analysis regions overlapping all genomic regions examined that exhibited significant differences in mean methylation level (MML) and normalized methylation entropy (NME), as well as significant discordance in the probability distribution of methylation quantified by the coefficient of methylation divergence (CMD). (b) Venn diagram of significantly dysregulated analysis regions that overlap gene bodies. (c) Venn diagram of significantly dysregulated analysis regions that overlap promoter regions. (d) Venn diagram of significantly dysregulated analysis regions that overlap known repetitive elements.

