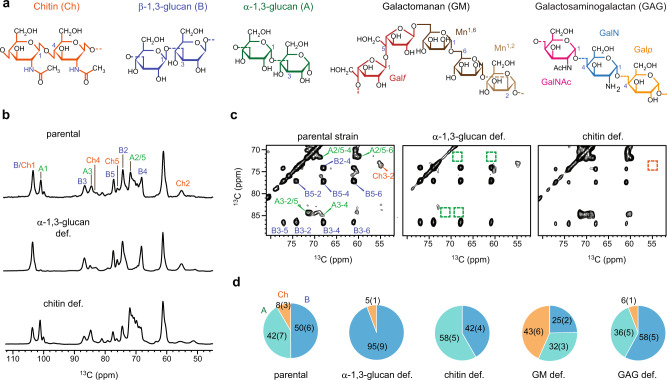
Fig. 1. Structural changes in the rigid core of A. fumigatusmutant cell walls.
a Representative structures of fungal carbohydrates. Abbreviations are shown for different polysaccharides and sugar units. b 1D 13C–CP spectrum showing different intensities for rigid polysaccharides. Abbreviations are used for resonance assignments. For example, A1 denotes α-1,3-glucan carbon 1. Ch and B represent chitin and β-1,3-glucan, respectively. c 2D 13C–13C correlation spectrum with 53 ms CORD mixing detecting intramolecular cross peaks. For example, B3-5 is the cross peak between β-1,3-glucan carbon 3 and carbon 5. The missing peaks of α-1,3-glucan and chitin in two mutants are highlighted using dash line boxes. d Estimation of polysaccharide composition in the rigid portion of cell walls. Chitin, α-1,3-glucan, and β-glucans are shown in orange, green, and blue, respectively. The percentage values represent the molar fraction of rigid polysaccharides as estimated using the integrals of cross peaks in 2D CORD spectra, which is detailed in Supplementary Table 3. Standard errors included in the parentheses are based on data presented in Supplementary Fig. 3 and computed as described in the Supplementary Methods. Source data of (d) are provided as a Source Data file.

