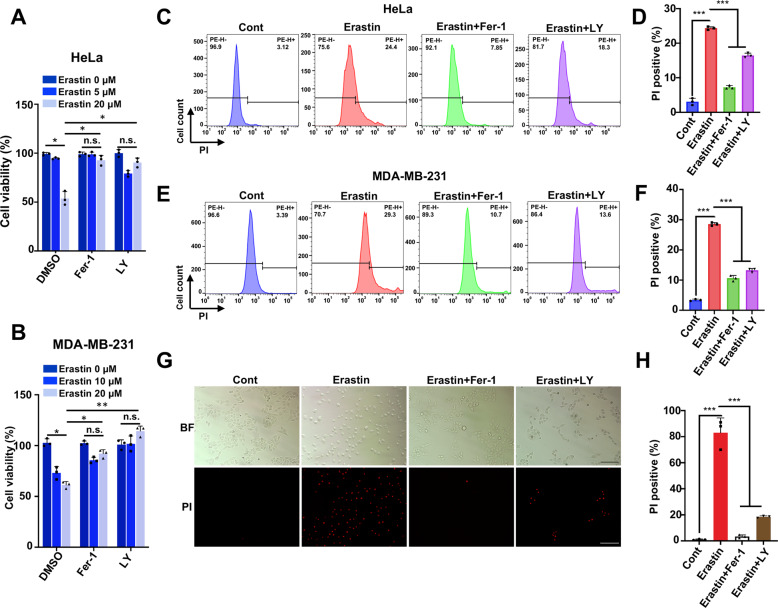
Fig. 1. Inhibition of GSK-3β kinase activity promotes resistance to ferroptotic cell death.
A Cell viability was assessed using CCK8 in indicated HeLa cells treated with erastin (0, 5, 20 μM) with or without ferrostatin-1 (Fer-1, 20 μM), with or without pretreated with GSK-3α/β inhibitor LY2090314 (LY, 20 nM) for 2 h prior to erastin treatment. B Indicated MDA-MB-231 cells were treated with erastin (0, 10, 20 μM) with or without ferrostatin-1 (Fer-1, 20 μM), or GSK-3α/β inhibitor LY (20 nM), respectively, and cell viability was assayed by CCK8. C Representative plotting data of HeLa cells from flow cytometry (FCM) analysis. Indicated HeLa cells were treated with erastin (35 μM), with or without Fer-1 (20 μM), with or without LY (20 nM) for 24 h, dead cells were determined as propidium iodide (PI) positive cells detected by FCM. D The percentage of PI-positive cell population in C was analyzed using FlowJo software (Version 10.0). E Representative plotting data of MDA-MB-231 cells from flow cytometry (FCM) analysis. Indicated MDA-MB-231 cells were treated with erastin (40 μM), with or without Fer-1 (20 μM), or LY (20 nM) for 24 h, dead cells were determined as propidium iodide (PI) positive cells detected by flow cytometry. F The percentage of PI-positive cell population in E was analyzed using FlowJo software (Version 10.0). G Fluorescence microscopy images with PI staining (in red) reflecting cell death after erastin treatment for HeLa cells at 35 μM combined with or without Fer-1(20 μM) and LY (20 nM). Upper, bright field (BF); Down, PI signal (PI). Scale bar, 200 μm. H The cell death (PI positive cells) in G was quantified. Data shown represent mean ± SD from three independent experiments. Shown above is representative image from three independent replicates. Statistical analysis was made using Student’s t-test; *p < 0.05, **p < 0.01, ***p < 0.001.

