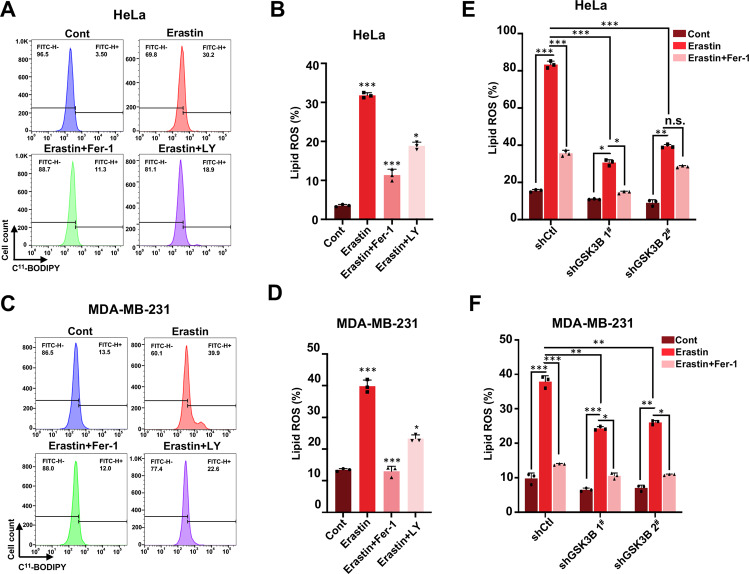
Fig. 3. GSK-3β inhibition or GSK-3β knockdown affects the accumulation of lipid ROS.
A Representative plotting data of HeLa cells through flow cytometry (FCM) analysis. Indicated HeLa cells were treated with erastin (35 μM) with or without Fer-1 (20 μM) or LY (20 nM) for 24 h, and lipid ROS production was detected by FCM after incubation with fluorescent probe C11-BODIPY. B Statistical analysis of the percentage of C11-BODIPY positive cells in A from three independent experiments. C Representative plotting data of MDA-MB-231 cells from flow cytometry (FCM) analysis. Indicated MDA-MB-231 cells were treated with erastin (45 μM) with or without Fer-1 (20 μM) or LY (20 nM) for 24 h, and lipid ROS production was detected by FCM using C11-BODIPY probe. D Statistical analysis of the percentage of C11-BODIPY positive cells in C from three independent experiments. E Indicated shCtl, shGSK-3β 1#, and 2# HeLa cells were treated with erastin (35 μM) with or without Fer-1 (20 μM) for 24 h, lipid ROS production was assayed by flow cytometry using C11-BODIPY. Statistical analysis of percentage of C11-BODIPY positive cells was performed from three independent experiments. F Indicated shCtl, shGSK-3β 1# and 2# MDA-MB-231 cells were treated with erastin (40 μM) with or without Fer-1(20 μM) for 24 h, and lipid ROS production was assayed by flow cytometry using C11-BODIPY. The numbers of BODIPY positive cells were quantitated. Data shown represent mean ± SD from three independent experiments. Statistical analysis was made using Student’s t-test; *p < 0.05, **p < 0.01, ***p < 0.001.

