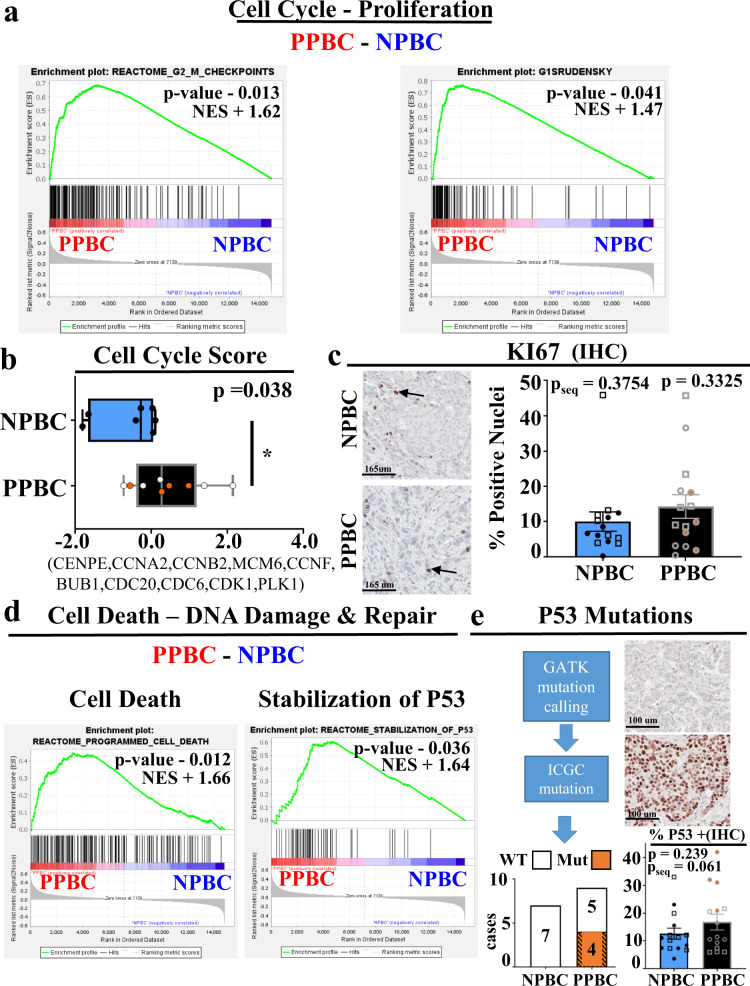
Fig. 3. Cell Cycle and TP53 gene signatures, TP53 mutational analysis, and immunohistochemical validation.
Detailed examination of the proliferation, cell death, and DNA damage pathways, as identified by RNA expression profiling described in Fig. 2, and IHC examination of these pathways. Depiction of a two additional GSEA enrichment plots for cell cycle. b Single sample cell cycle score determined from RNA expression values from the indicated genes (PPBC n = 9, NPBC n = 7). Data are presented as a minimum to maximum with median value marked by a line within the depicted interquartile range, and p value determined by Students’ unpaired two-tailed t test with Welch correction. c Examples of immunohistochemical (IHC) evaluation of KI67-positive (brown color) protein expression (left), with quantification of KI67 signal evaluated as the proportion of nuclei (right, PPBC n = 15, NPBC n = 15) Data are presented as mean values ±SEM, and p value determined by Students’ unpaired two-tailed t test with Welch correction. Samples evaluated by RNA Seq are depicted by circles and pseq refers to p values for these samples only, while expanded cases for IHC are depicted by squares and p values reflect values for the whole cohort. d GSEA analysis assessments of cell death (left) or DNA damage and repair associated gene sets (TP53, right) (PPBC n = 9, NPBC n = 7). e Flow diagram outlining computational steps and results for prediction of the presence of wildtype (WT) or mutant (MUT) TP53 genes in PPBC (n = 9) and NPBC (n = 7) cohorts utilizing RNA Seq expression data (left), and P53 protein expression (brown color) assessed by IHC (PPBC = 15, NPBC = 15), with P53 signal reported as percent positive area (right). Data are presented as mean values ±SEM and p value assessed by students’ unpaired two-tailed t test with Welch correction. International Cancer Genome Consortium (ICGC) identified TP53 mutations are noted by orange-filled circles. For GSEA plots, p values and normalized enrichment score (NES) were determined by GSEA software103 comparing PPBC (red, n = 9) and NPBC (blue, n = 7) biologically independent samples as described in Fig. 1 and 2.

