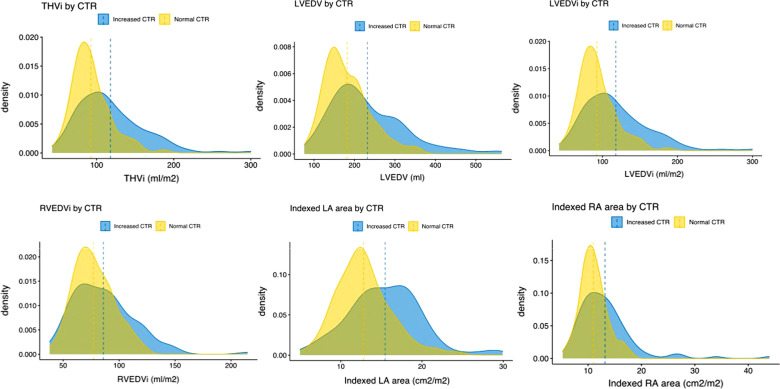
Fig. 4.
Density plots representing distributions of cardiac MRI parameters in patients with normal and increased CTR. Density plots are a variation of histograms that allow to observe the distribution of a variable in a dataset in a continuous fashion. They are instrumental in demonstrating the extensive overlap of cardiac MRI derived values between patients with normal and increased CTR. Dashed lines represent the means for each distribution. Note that mean values are larger in patients with CTR > 50%. This explains the described positive but weak correlations. THVi total heart indexed volume, LVEDV left ventricular end-diastolic volume, LVEDVi left ventricular indexed end-diastolic volume, RVEDVi right ventricular indexed end-diastolic volume, LA left atrium, RA right atrium, CTR cardiothoracic ratio

