Figure 4.

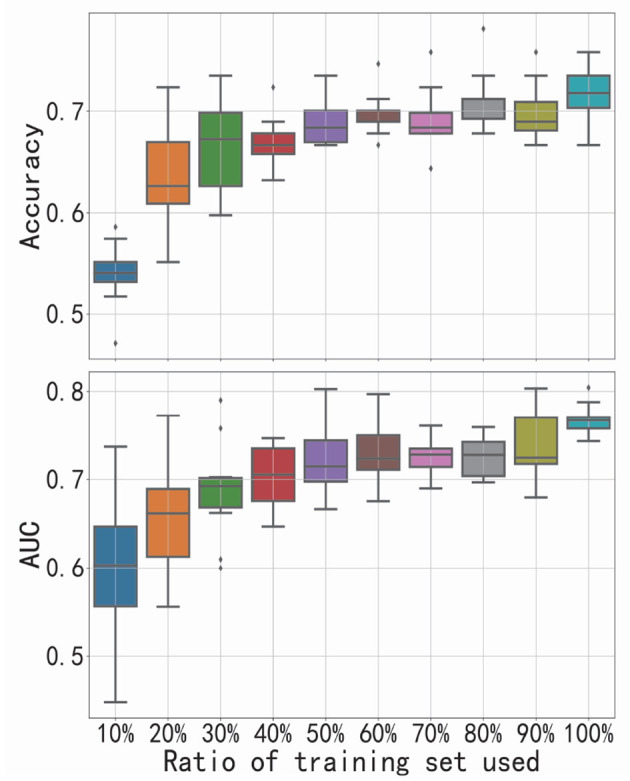
Performance of functional graph discriminative network (FGDN) as the increasing ratio of training set used. Boxplots denote the variant of classification accuracy/area under the curve (AUC) across 10-fold cross-validation.

Performance of functional graph discriminative network (FGDN) as the increasing ratio of training set used. Boxplots denote the variant of classification accuracy/area under the curve (AUC) across 10-fold cross-validation.