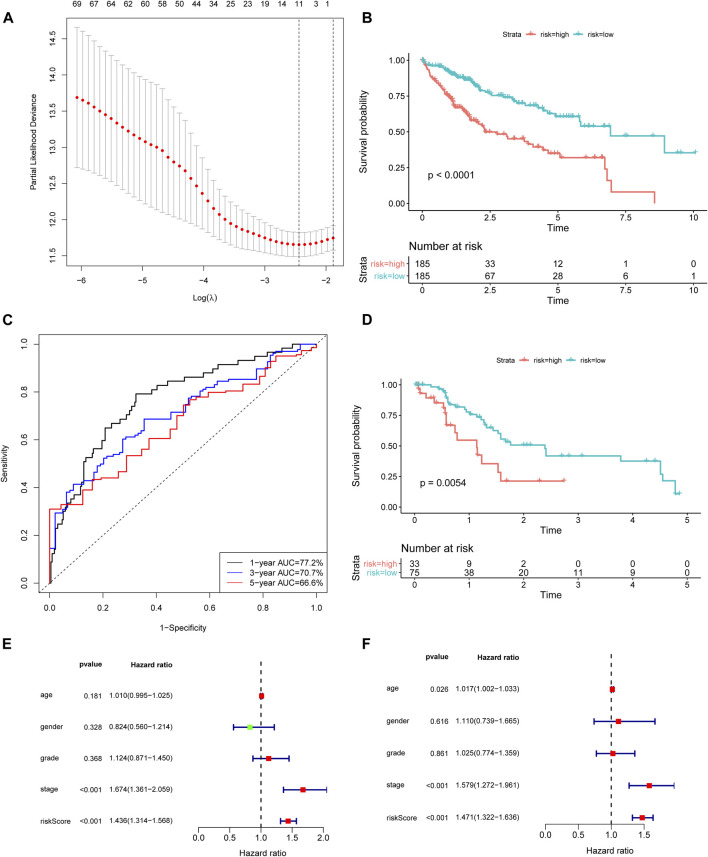
FIGURE 1.
Construction and validation of the ferroptosis-related lncRNA signature. (A) Lasso coefficient profiles indicated that 11 ferroptosis-related lncRNAs should be retained in the model. (B) The K-M curve showed that the high-risk group (red curve) had a poorer OS than the low-risk group (blue curve) in TCGA cohort. (C) ROC curve of the ferroptosis-related lncRNA model. The AUCs of 1-, 3-, and 5 years OS were 0.772, 0.707, and 0.666, respectively. (D) The prognostic difference between high- and low-risk patients of GSE76427. (E) Univariate analysis and (F) Multivariate analysis of the lncRNA model and clinical features. lncRNA: long noncoding RNA; Lasso: least absolute shrinkage and selection operator; K-M curve: Kaplan–Meier curve; OS: overall survival; ROC curve: receiver‐operating characteristic curve.

