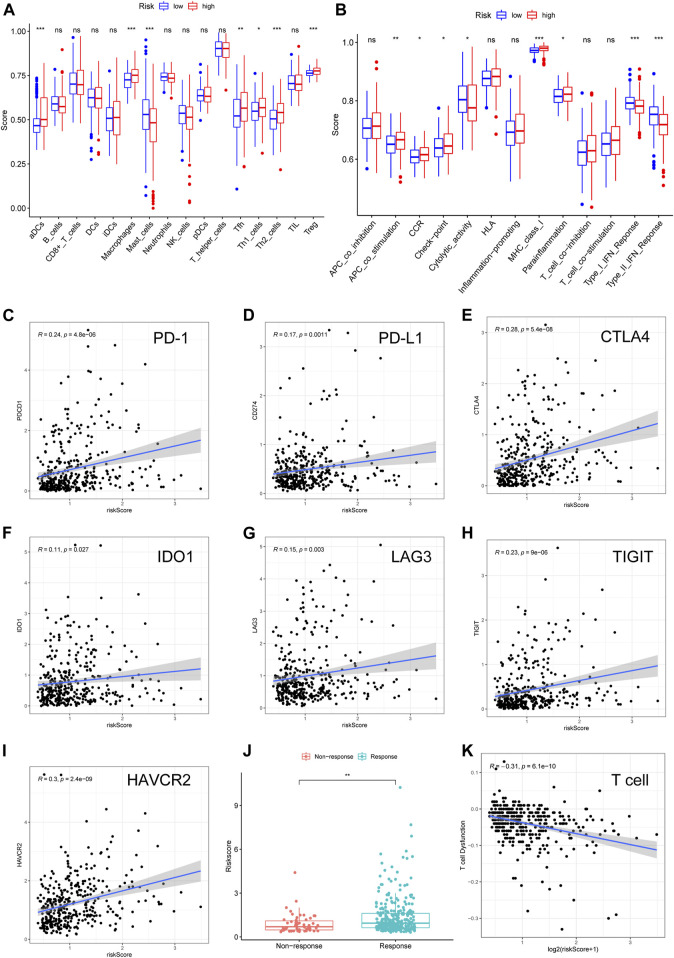
FIGURE 6.
Validation of the ferroptosis-related lncRNA model in TICs and immunotherapy. The scores of (A) 16 immune cell subpopulations and (B) 13 immune-related functions varied in the high- and low-risk groups. (C–I) The correlation between seven important checkpoint molecules and the risk scores of HCC patients. (J) The relationship between risk score and response to immunotherapy was determined using the TIDE algorithm. (K) The relationship between T cell dysfunction and log2 (risk score). lncRNA: long noncoding RNA; TIC: tumor-infiltrating immune cells; TIDE: tumor immune dysfunction and exclusion. Log2: data log2 transformed.

