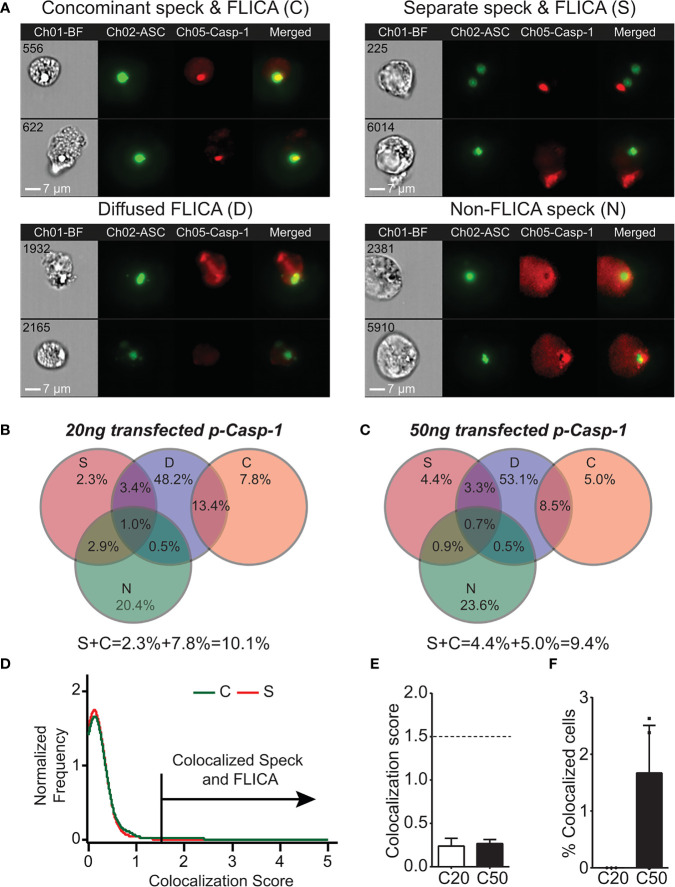
Figure 2.
Active caspase-1 does not colocalize with the ASC speck. HEK293T cells were transfected with 100 ng NLRP3, 50 ng GFP-ASC, and 20 or 50 ng CASP1 and treated with 5 µm nigericin for 2 h. ASC speck-positive cells were analyzed for distribution of active caspase-1 and ASC speck by inflammasome and caspase-1 activity characterization and evaluation (ICCE). Ch01-BF (brightfield), Ch02-GFP-ASC (green), Ch05-active caspase-1 (FLICA; red). The cells containing specks and active caspase-1 were manually segregated into four different subpopulations. (A) Representative images from the subpopulation of cells showing (top left) coincident ASC speck and active caspase-1 (C), (top right) distant ASC speck and active caspase-1 (S), (bottom left) diffused active caspase-1 (D), and (bottom right) specks lacking any detectable caspase-1 activity (N). The subpopulation of cells where active caspase-1 is diffused around the ASC speck. (B) Venn diagram showing the frequency of different subpopulations in cells transfected with 20 ng CASP1 (C20). (C) Venn diagram showing the frequency of different subpopulations in cells transfected with 50 ng CASP1 (C50). (D) Colocalization analysis of ASC speck and active caspase-1 of images shown in (A) (subpopulation C); histogram showing the threshold criteria for colocalization assay. (E) Mean colocalization score of images shown in (A); a threshold score of 1.5 was selected as positive for colocalization. (F) Frequency of colocalized events over total events noted above the threshold line for C20 (20 ng) and C50 (50 ng) amount of transfected CASP1. Data represented as mean ± SEM for a minimum of three independent experiments. Data represented as mean for (B).

