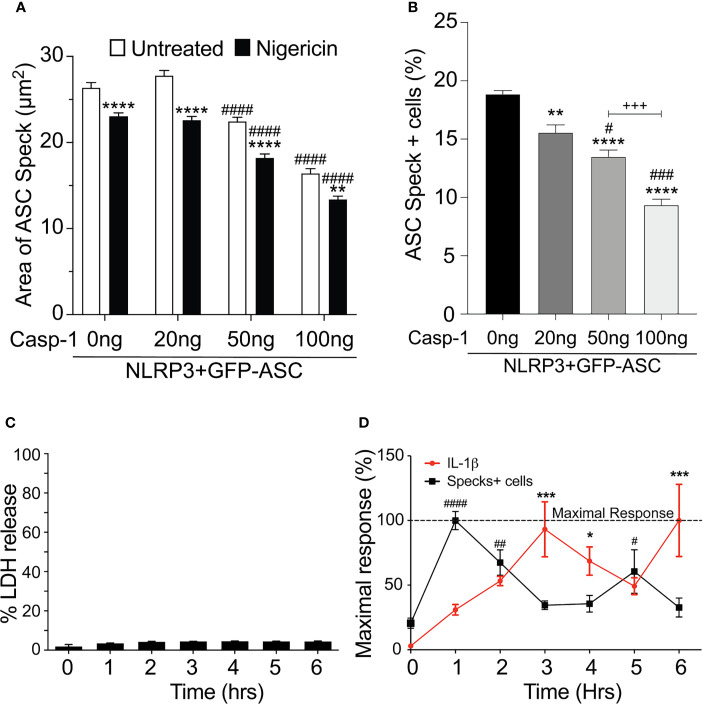
Figure 5.
Speck formation and IL-1β release are cyclic and negatively correlated. (A, B) HEK293T cells were transfected with 50 ng GFP-ASC, 100 ng NLRP3, and 20 or 50 or 100 ng CASP1 and treated with 5 µm nigericin for 2 h. Following nigericin treatment, cells were stained with FLICA, fixed, and analyzed for the presence of speck and active caspase-1 by ICCE. (C, D) PMA differentiated THP-1 cells are either left untreated (0 h) or treated with 5 μM nigericin for 6 h. Culture supernatant was harvested at the stated time intervals to measure IL-1β by ELISA and the release of LDH. Cells were fixed and stained for ASC to detect specks. (A) Cells were analyzed for the presence of ASC speck and active caspase-1 (positive for FLICA staining) from the double-positive gates as analyzed by ICCE. The area of the speck mask was calculated by ICCE. Data represented as mean ± SEM for a minimum of three independent experiments. **p < 0.01, ****p < 0.0001 for comparison with respective untreated, two-way ANOVA followed by Sidak’s multiple comparison tests. #### p < 0.0001 for comparison with respective untreated, two-way ANOVA followed by Dunnett’s multiple comparison tests. (B) Cells positive for GFP-ASC were analyzed for the presence of ASC specks by ICCE. Data represented as mean ± SEM for a minimum of three independent experiments. **p < 0.01, ****p < 0.0001 for comparison with 0 ng transfected casp-1; # p < 0.05, ### p < 0.001 for comparison with 50 ng transfected casp-1; +++ p < 0.001 for comparison between 50 and 100 ng transfected casp-1; one-way ANOVA followed by Tukey’s multiple comparison tests. (C) Percentage LDH release compared with 0.09% Triton X-100-lysed cells. (D) Line graph showing the frequency of ASC speck+ cells (red) and the release of IL-1β (black). Data are normalized to maximal response of speck frequency and released IL-1β over the time course of the experiment. Data represented as mean ± SEM for a minimum of three independent experiments. *p < 0.05, ***p < 0.001, for comparison of IL-1β release with untreated control (0 h); # p < 0.05, ## p < 0.01, #### p < 0.0001 for comparison of speck frequency with untreated control (0 h); one-way ANOVA followed by Sidak’s multiple comparison tests.

