Figure 6.
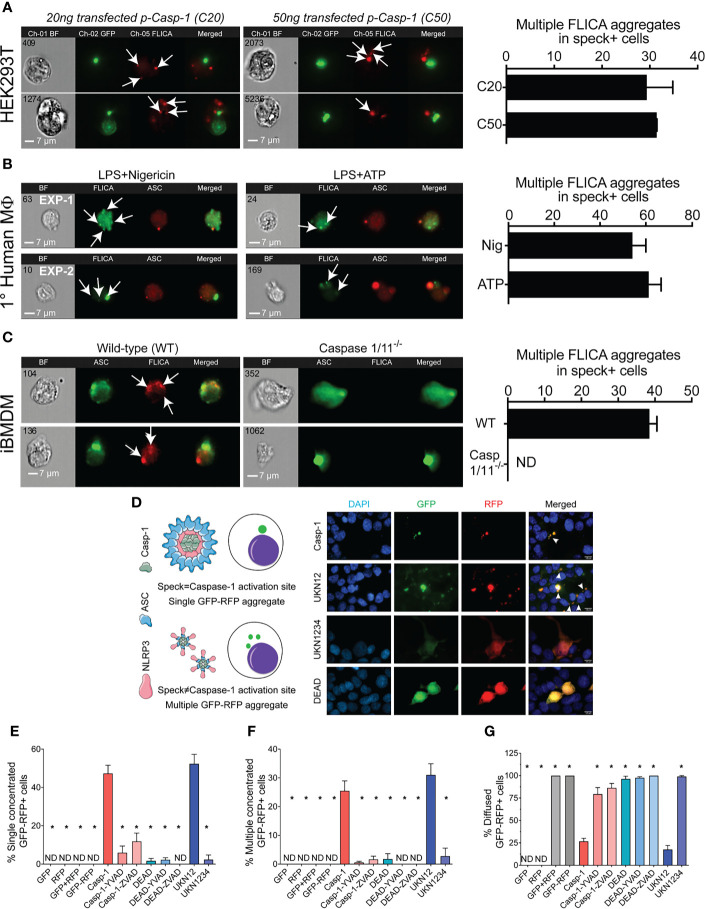
NLRP3-dependent caspase-1 activity occurs at multiple cellular sites. LPS-primed primary human monocytes and immortalized BMDM cells were either left untreated or stimulated with 5 mM ATP or 10 µm nigericin for 30 min, stained with FLICA, and were fixed and analyzed by ICCE. HEK293T cells were transfected with 50 ng GFP-ASC with or without 100 ng NLRP3 and stimulated with 5 μM nigericin. Following nigericin stimulation, cells were stained with FLICA, fixed, and analyzed by ICCE. (A) (Left) The ASC (green) speck+ cells containing active caspase-1 (red) showed multiple FLICA (active caspase-1) aggregates in both cells transfected with 20 and 50 ng of CASP1. (Right) The frequency of cells containing speck and multiple FLICA aggregates. Data represented as mean ± SEM. (B) (Left) Primary human macrophages containing ASC speck (red) showing FLICA staining for active caspase-1 (green) as diffused and/or aggregated (multiple and distant from the speck). Representative images from two independent experiments are shown. (Right) The frequency of speck+ cells containing multiple FLICA aggregates. Data represented as mean ± SEM. (C) (Left) Immortalized BMDMs containing ASC speck (green) showing FLICA staining for active caspase-1 (red) as diffused and/or distant aggregates from ASC speck. Caspase-1/11−/− BMDMs show no FLICA staining showing specificity of staining. (Right) The frequency of cells containing speck and multiple FLICA aggregates. Data represented as mean ± SEM. (D–G) HEK293T cells were transfected with 100 ng myc-ASC, 100 ng NLRP3, 400 ng CASP1 (WT or mutant), and 400 ng GFP-YVAD-RFP. Eighteen hours post-transfection, cells were fixed and analyzed for GFP-RFP aggregates by microscopy. (D) Schematic diagram showing expected outcomes with bifluorescent reporter if single/multiple sites of active caspase-1 are present. Representative micrographs showing distribution of active caspase-1 sites in a cell; DAPI (blue), GFP (green), RFP (red), and merged. White arrows show cells with multiple GFP-RFP aggregates. (E) Frequency of cells containing single concentrated GFP-RFP aggregates. (F) Frequency of cells containing multiple concentrated GFP-RFP aggregates. (G) Frequency of cells containing diffused GFP-RFP. Data represented as mean ± SEM for each field of view for at least three independent experiments. A minimum of 1,000 cells were analyzed for each condition. *p < 0.0001, for comparison with casp-1-transfected sample, one-way ANOVA followed by Dunnett’s multiple comparison tests. ND, not detected.

