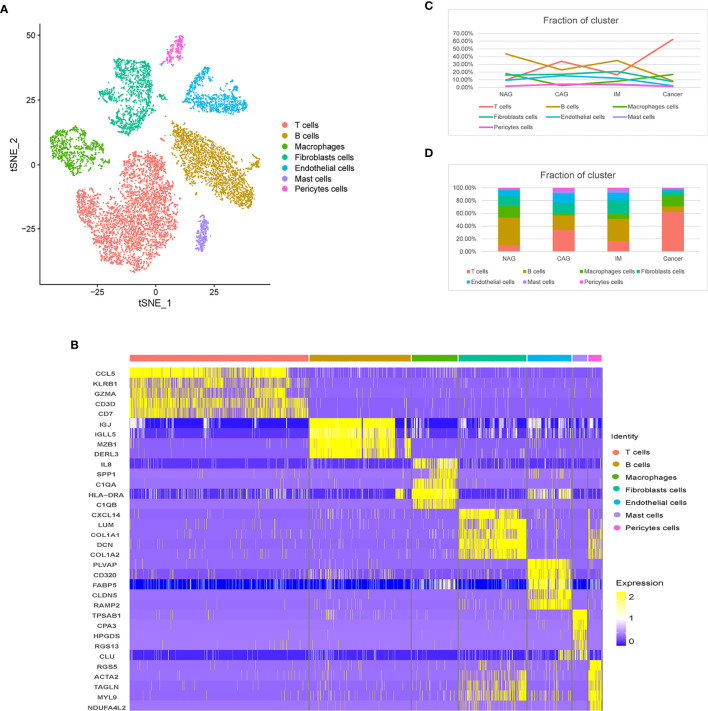
Figure 1.
Distinct TME cell populations and expression signatures. (A) tSNE plot of TME cells based on their differential expression. (B) Heatmap plots showing the expression of the top five marker genes of seven major cell types identified in this profile. (C) Line chart showing the trend of the proportion of TME cells across the four pathological stages (NAG-CAG-IM-GC). (D) Stacked histogram showing TME cell composition across the four pathological stages.

