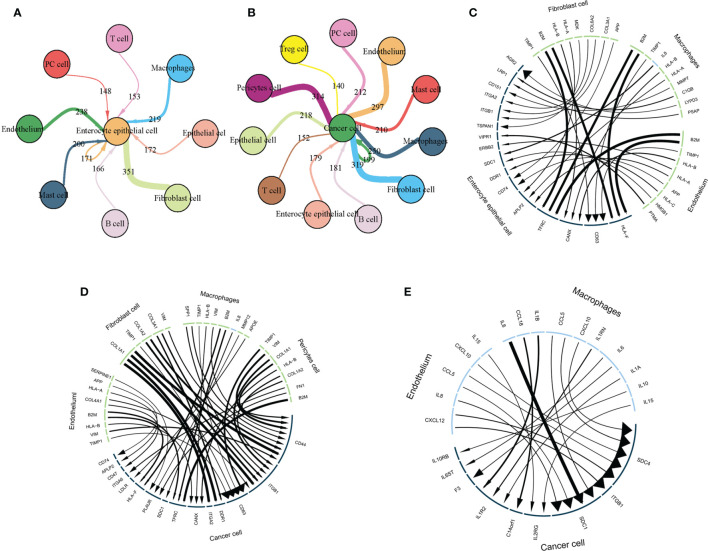
Figure 8.
TME interacts with intestinal epithelial and cancer cells via L-R. (A) The TME interacts with intestinal epithelium cells via L-R interactions. Circle size represents cell counts, line and arrow size represents interaction counts; larger sizes reflect more counts and interactions with each other. (B) The TME interacts with cancer cells via L-Rs. Circle size represents cell counts and line size represents interaction counts. A larger size means more counts and interactions with each other. (C) The strongest 10 L-R pairs showing interactions between fibroblasts, macrophages, and endothelial cells with intestinal epithelial cells. Line and arrow size represents interaction counts. (D) The strongest 10 L-R pairs showing interactions between fibroblasts, macrophages, and endothelial cells with cancer cells. Line and arrow size represents interaction counts. (E) Macrophages and endothelial cells interact with cancer cells via cytokines. Line and arrow size represents interaction counts.

