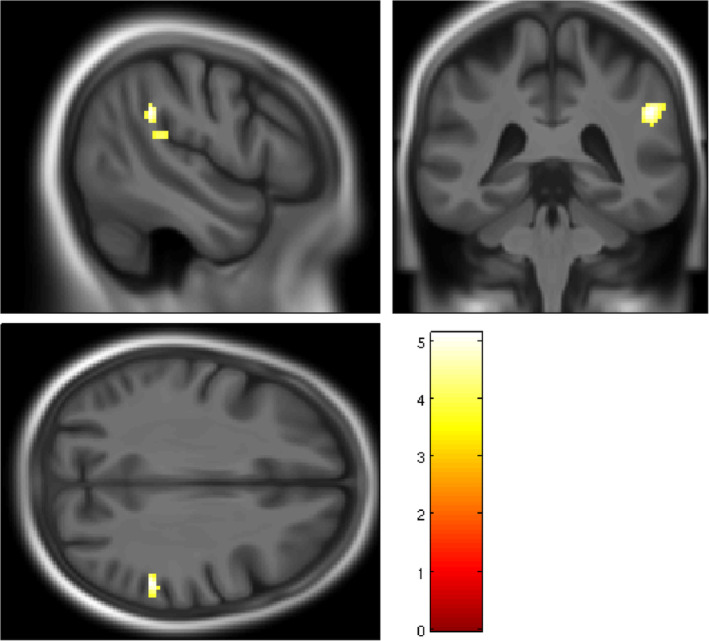
FIGURE 2.

Regions of significant positive correlation between correct answer response time and beta values of the Reflecting > Reading contrast (color bar represents t score)

Regions of significant positive correlation between correct answer response time and beta values of the Reflecting > Reading contrast (color bar represents t score)