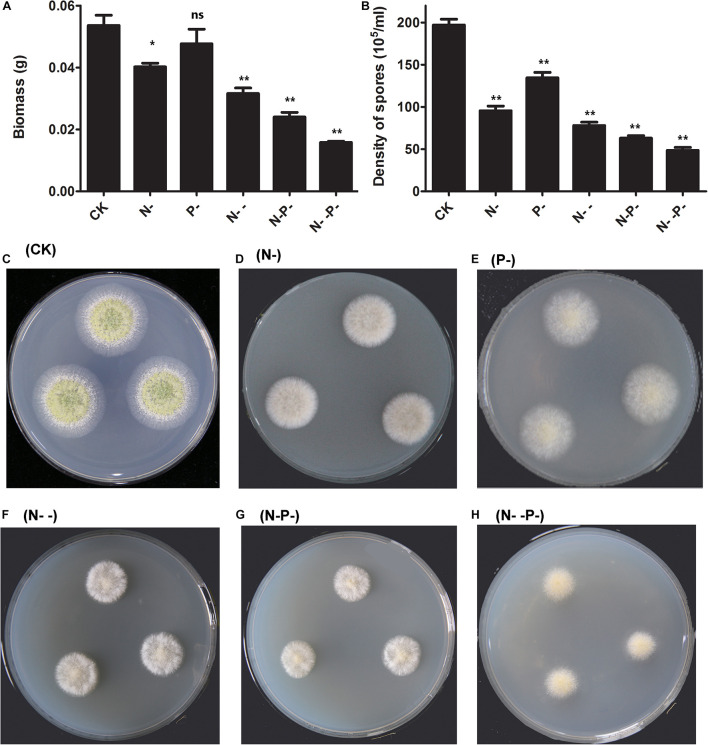
FIGURE 1.
The dry biomass and density of spores as affected by nitrogen and phosphorus. (A) The dry biomass under nitrogen and phosphorus limitation and the control. The mycelia were collected by peeling them off from the plates and dried overnight for the determination of biomass. (B) The density of spores under nitrogen and phosphorus limitation and the control. (C–H) The phenotype of A. oryzae strain under the condition of control and distinct N/P limitation. CK, N-, P-, N- -, N- P-, and N- -P- represent the control and distinct N/P-limited groups, respectively. The bars represent the average (±SE) of biological repeats. Asterisks indicate statistically significant differences between groups (Student’s t-test): *p < 0.05, **p < 0.01, ns, no significant difference.

